Tomorrow's Promise
Revisiting Du bois in a Modern Context
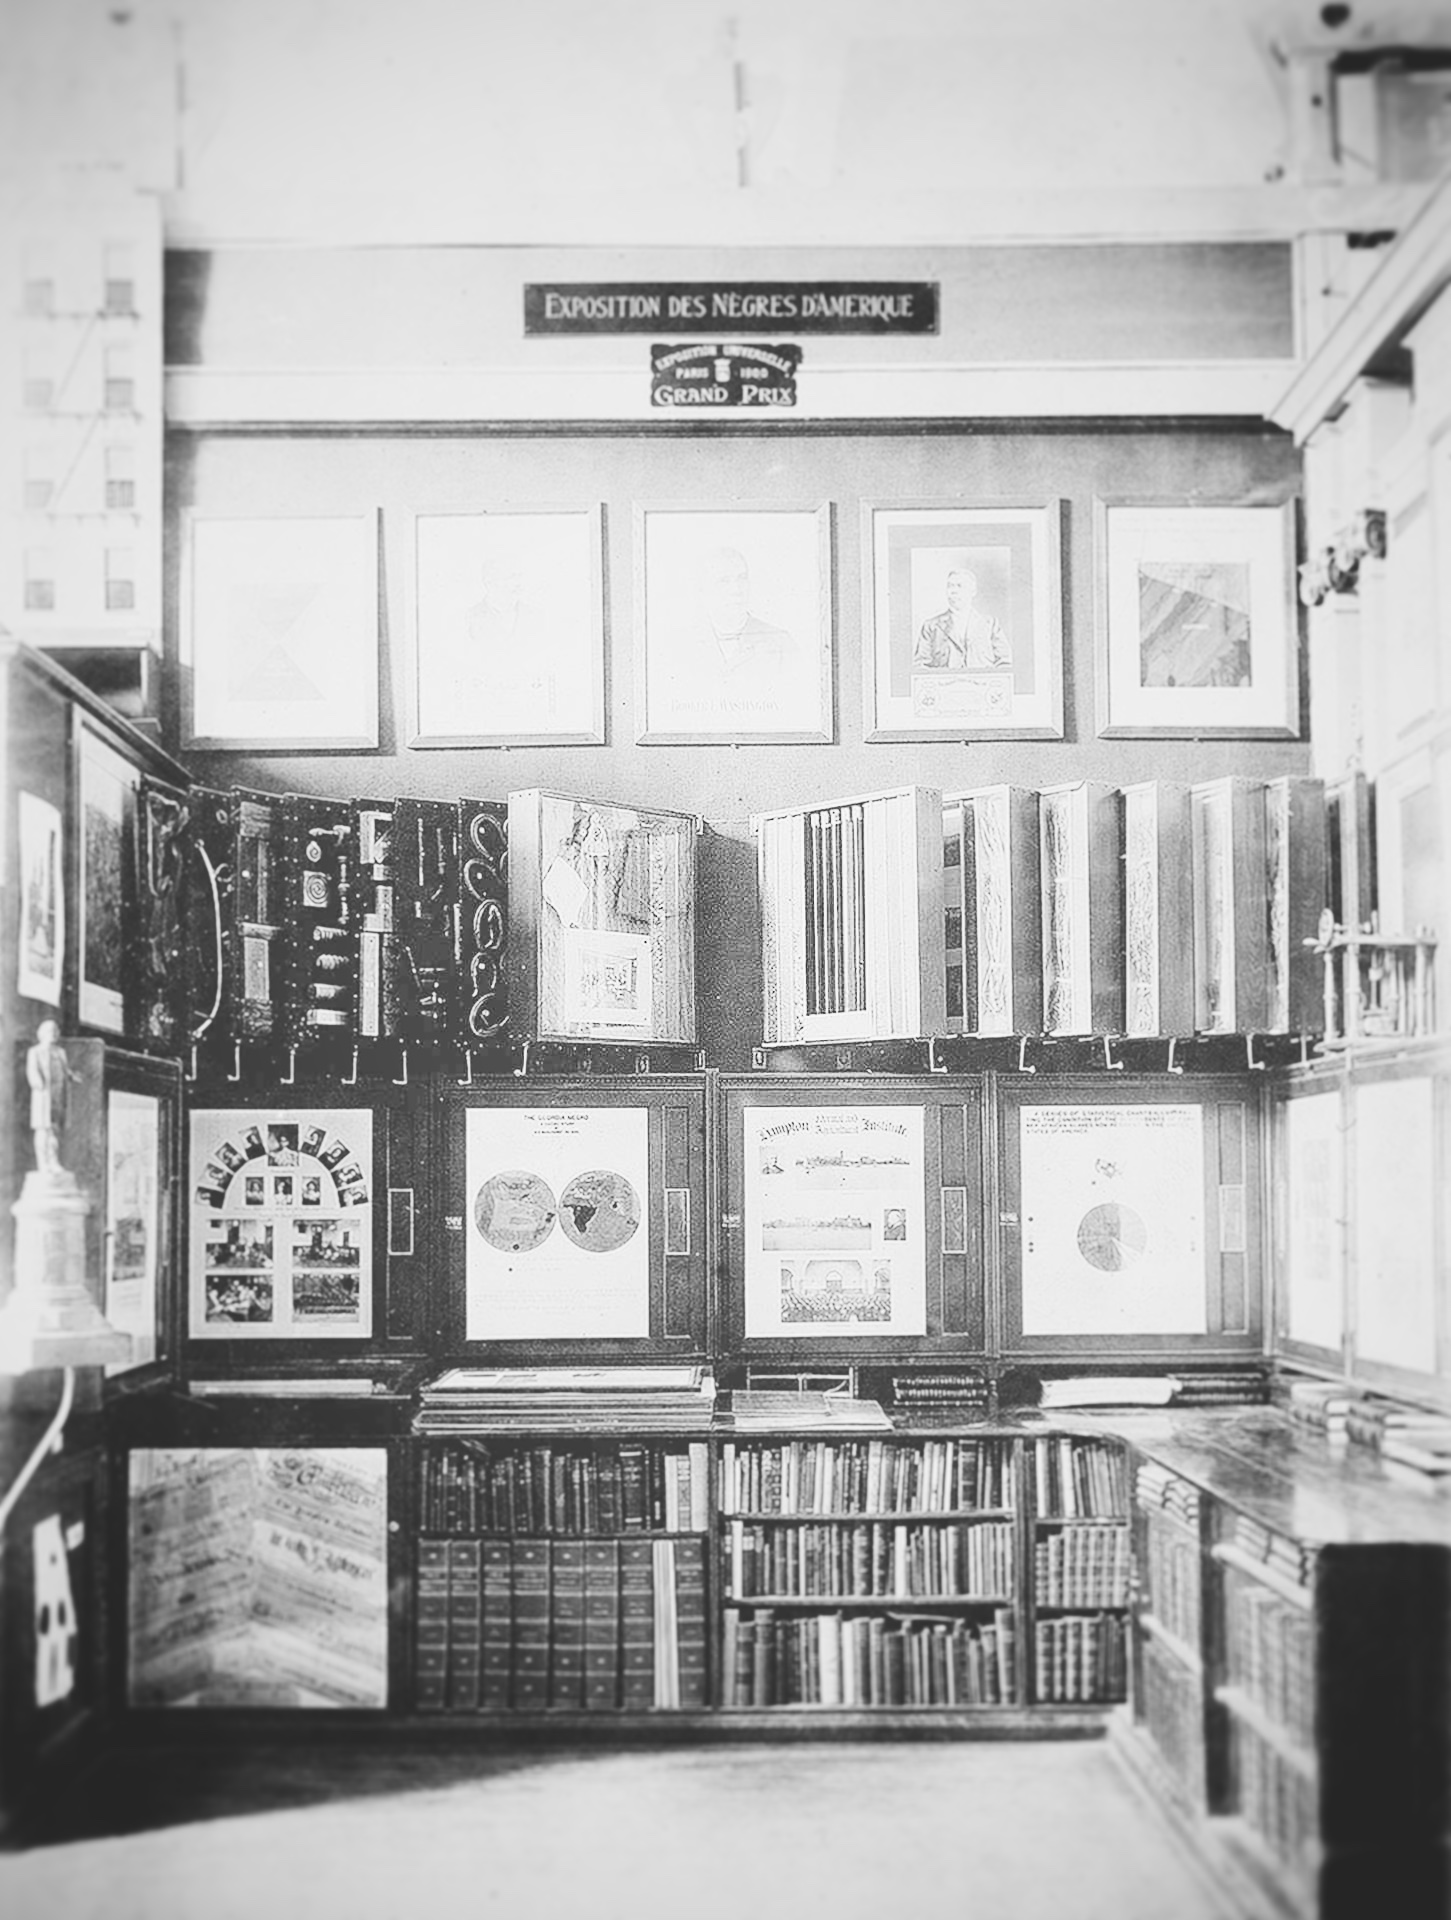
Beginning in late 2019, I had much more spare time and stumbled upon W. E. B. Du Bois's Data Portraits: Visualizing Black America, a book showcasing data visualizations created by W.E.B. Du Bois's team at the turn of the century. I was fascinated by the level of detail about African Americans' social and economic conditions during the turn of the century. It was beautiful to see how Du Bois used data visualization to show how the black community was no different than others.
Library of Congress, Prints & Photographs Division, LC-DIG-ppmsc-04826
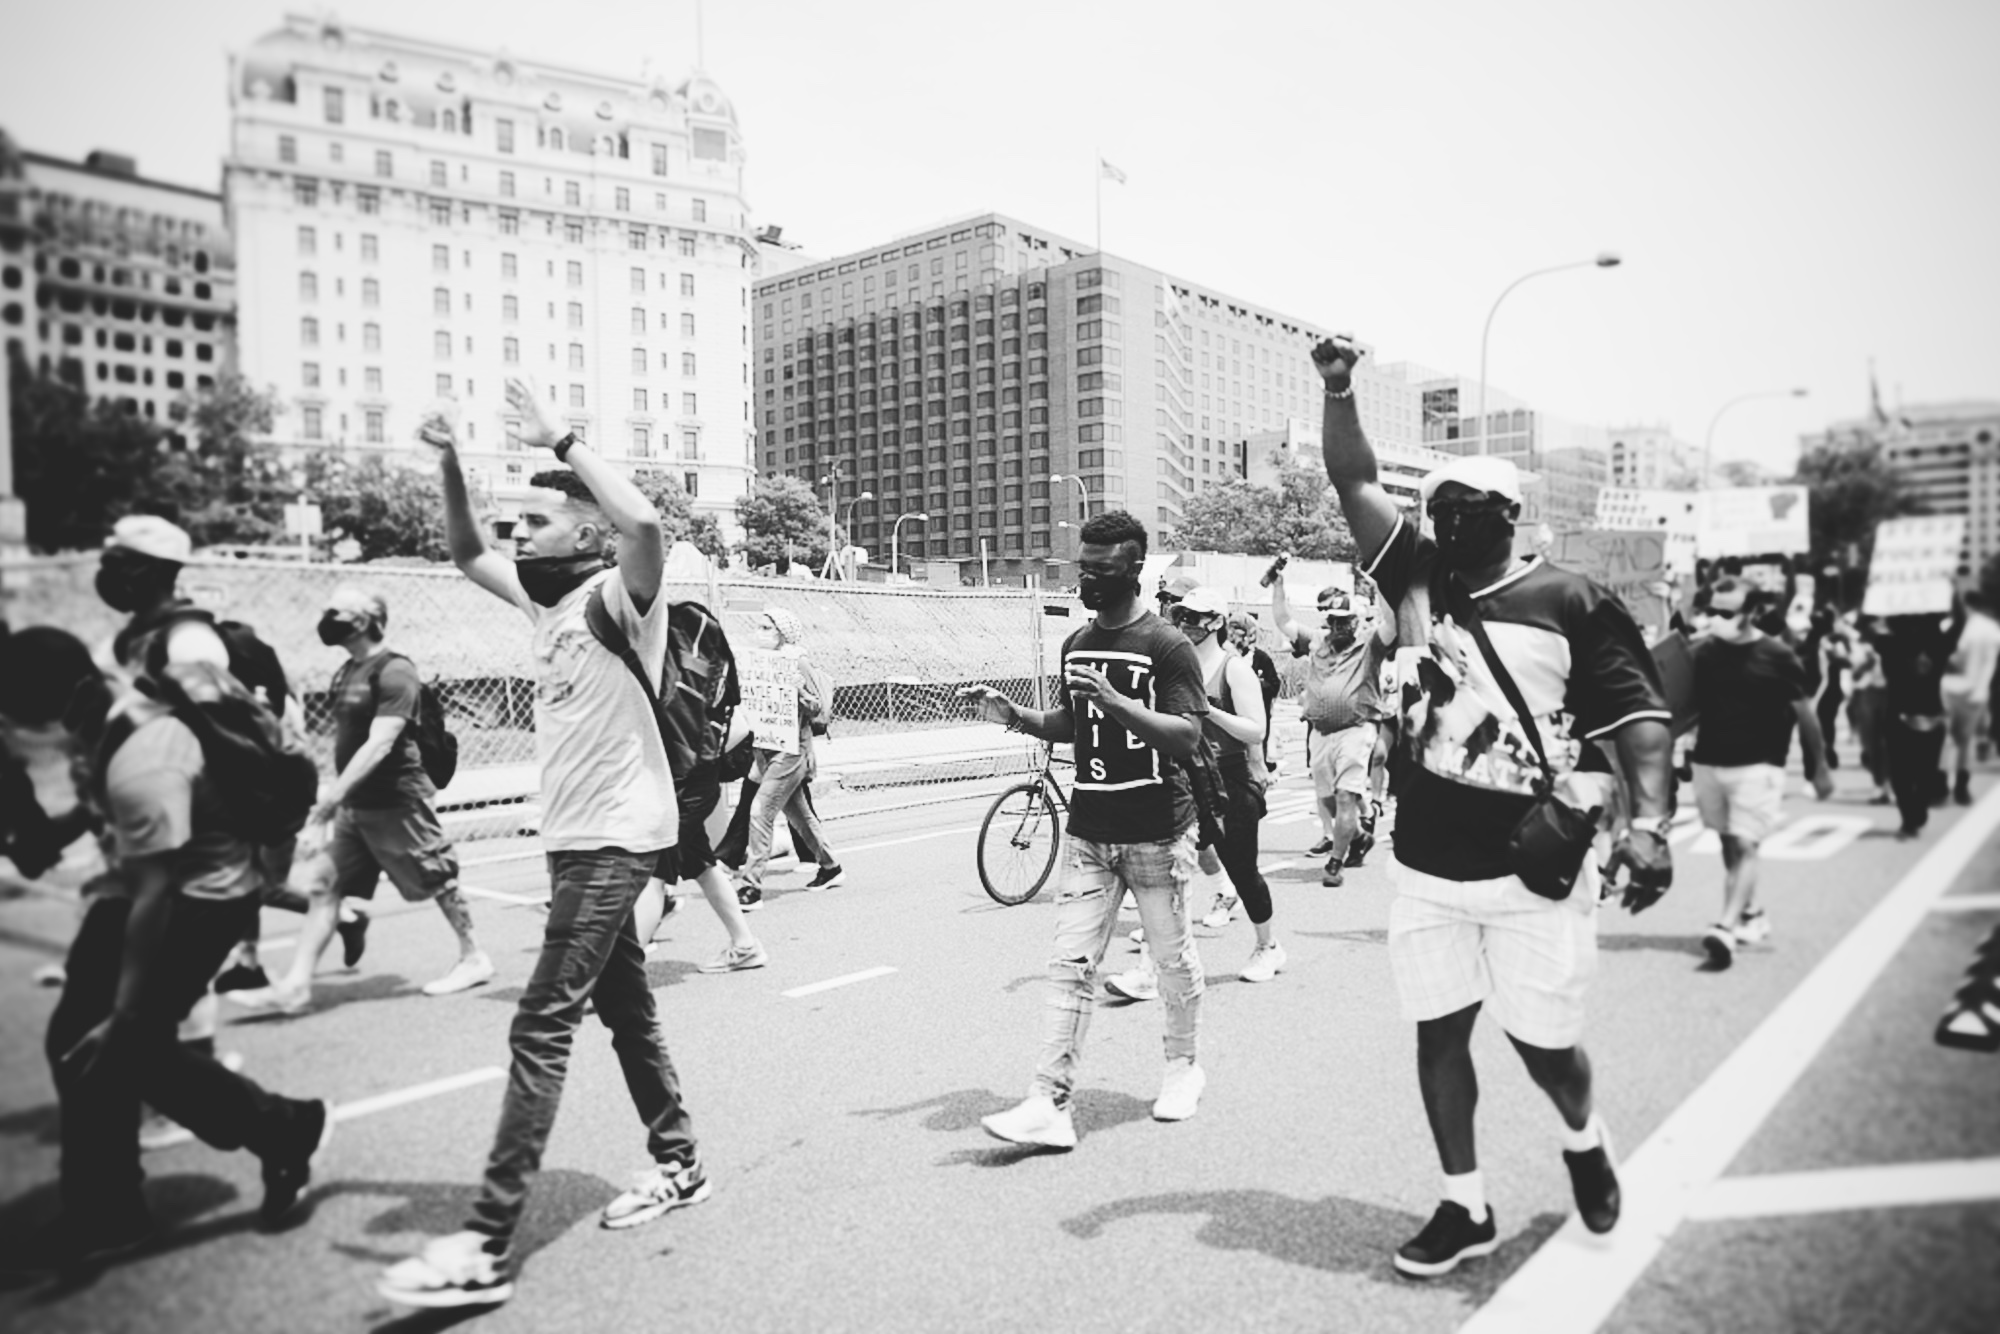
So much happened while we had extra time to reflect. I remember watching Black Lives Matter protests appear throughout the world to bring attention to some of the same mistreatment hundreds of years later. I couldn't help but wonder how much had changed, so I decided to recreate his designs and see how the data changed over time.
Highsmith, Carol M, photographer. One of the many Black Lives Matter events on or near Black Lives Matter Plaza in Washington, D.C. Washington D.C. Washington D.C. District of Columbia United States, 2020. -06-06. Photograph. https://www.loc.gov/item/2020720163/
Census Analysis
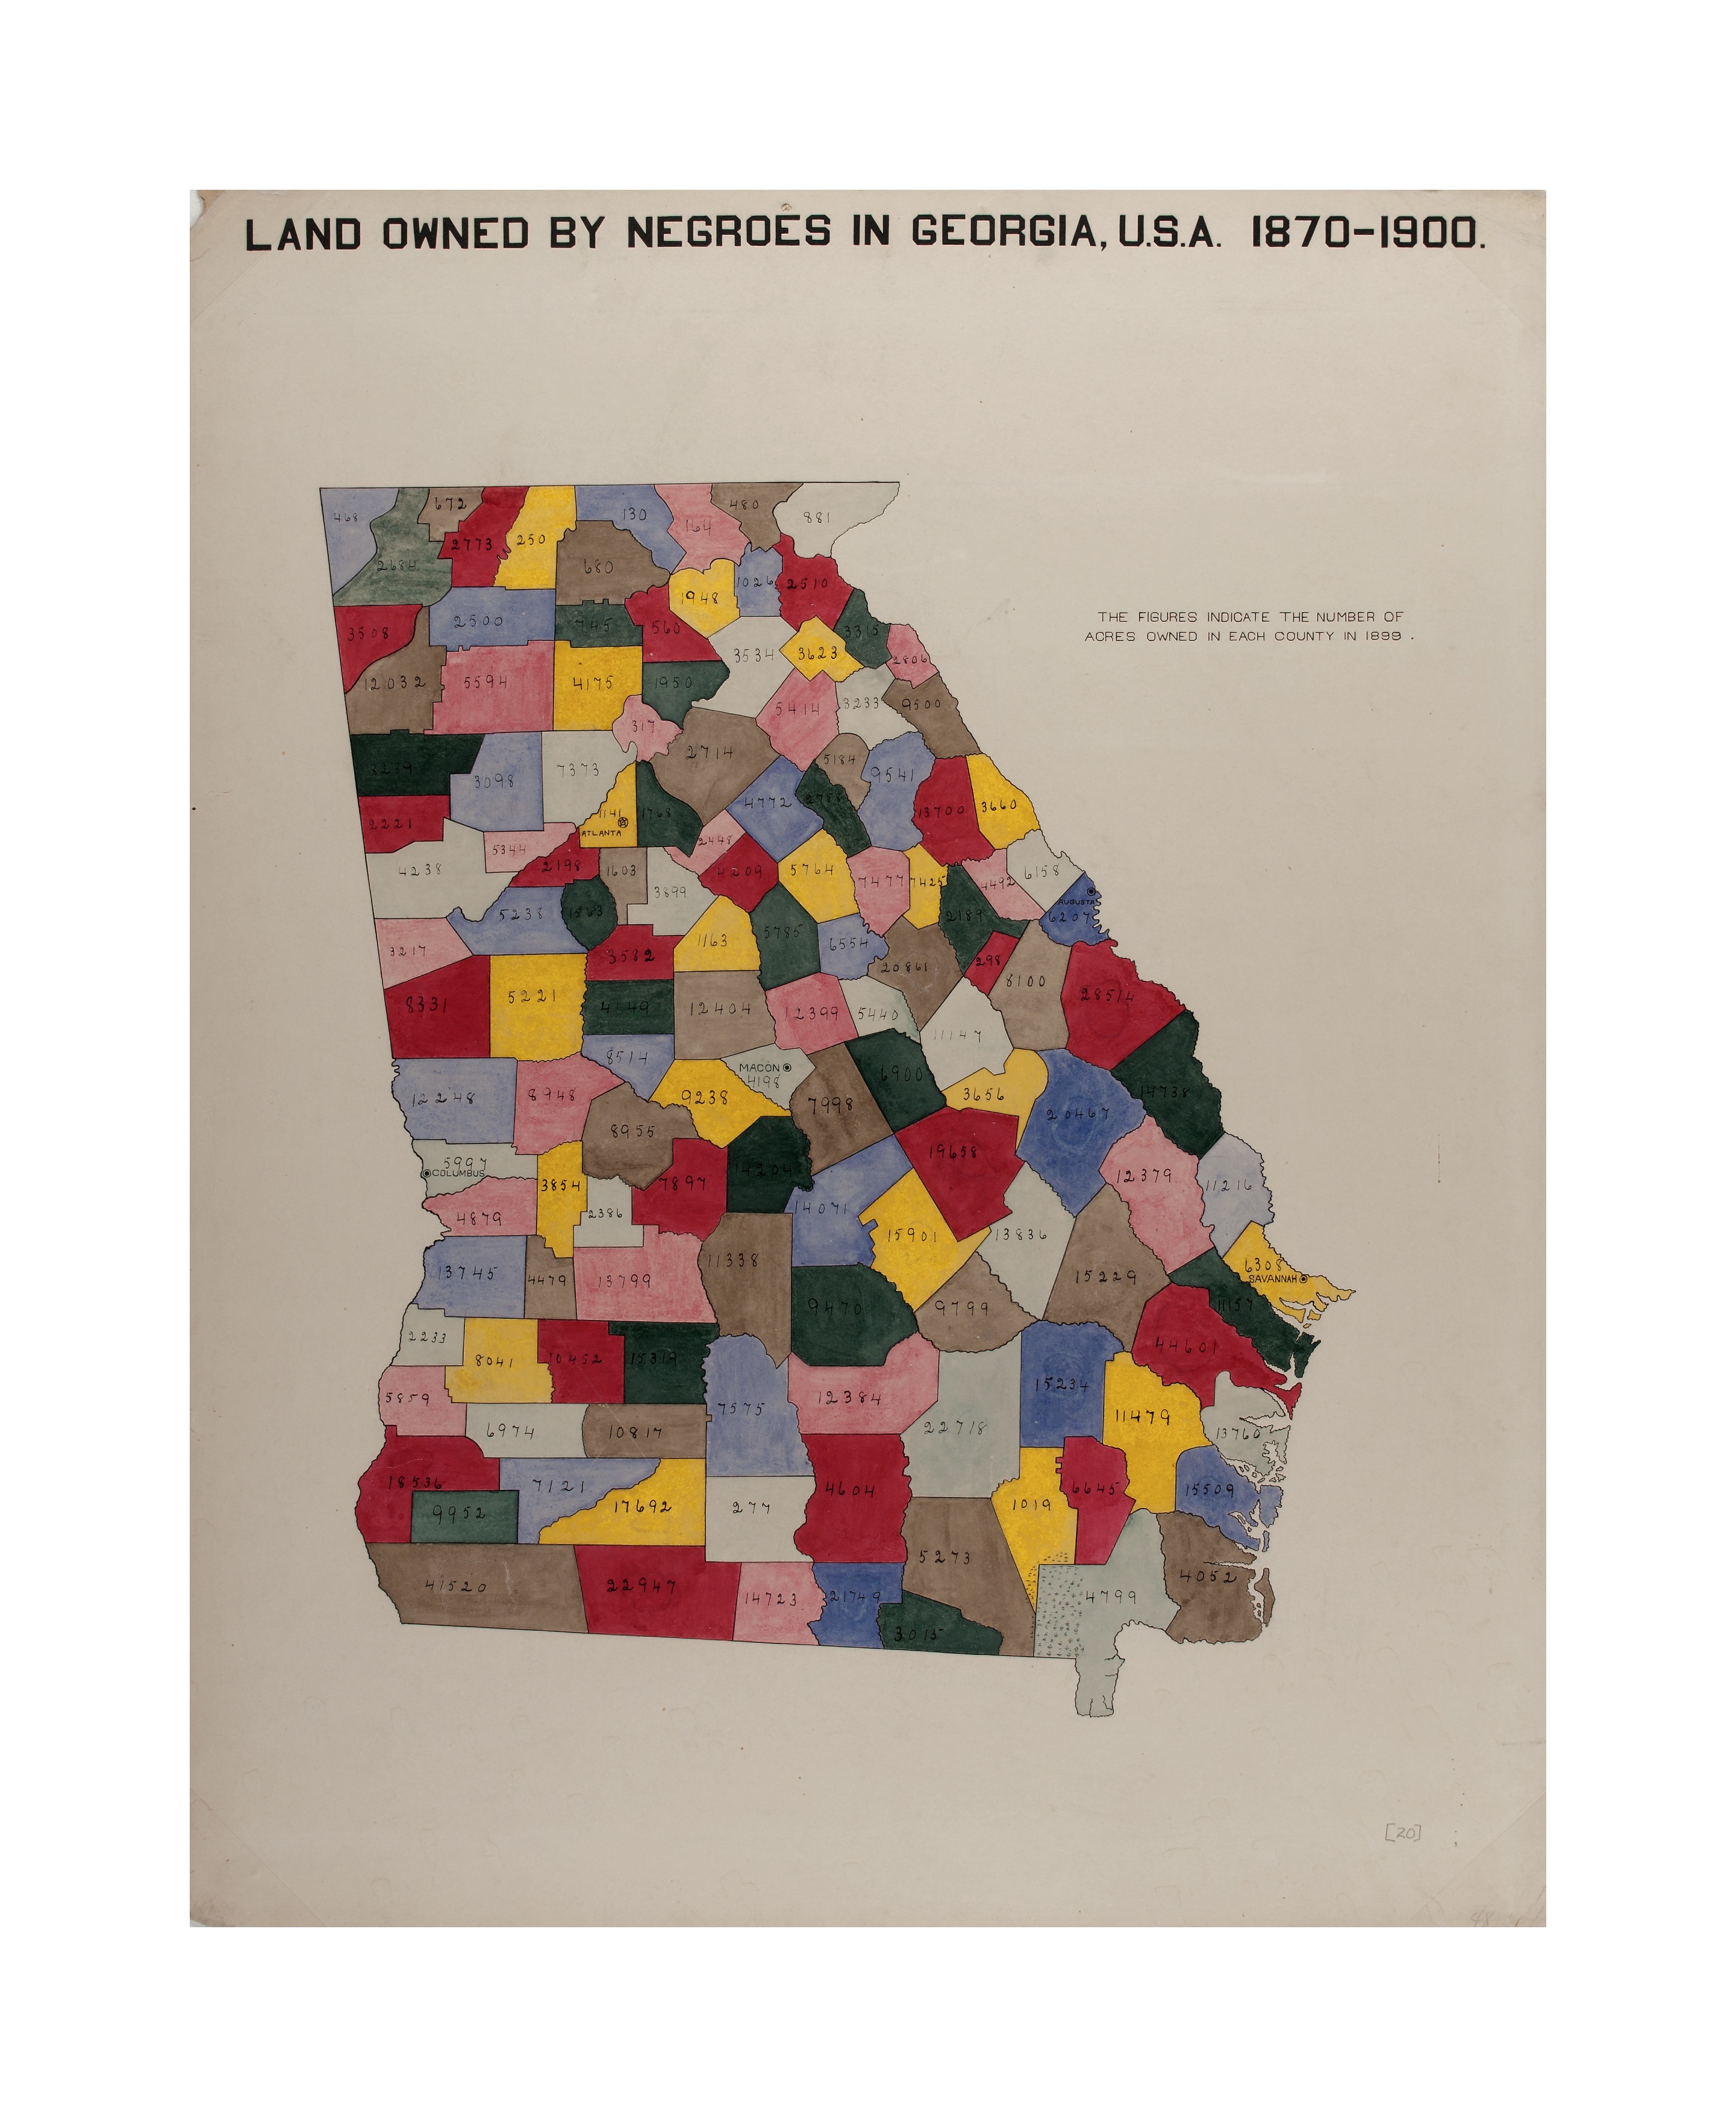
I started collecting as much historical census data as my computer could process. It was such a privilege to access so much information from the comfort of my home. W.E.B. Du Bois didn't have this luxury. Their team collected data by going house-to-house, conducting interviews, tabulating, and visualizing all their findings by hand. It's a tremendous privilege to attempt to expand his framework to a national scale.
Library of Congress, Prints & Photographs Division, LC-DIG-ppmsca-33882
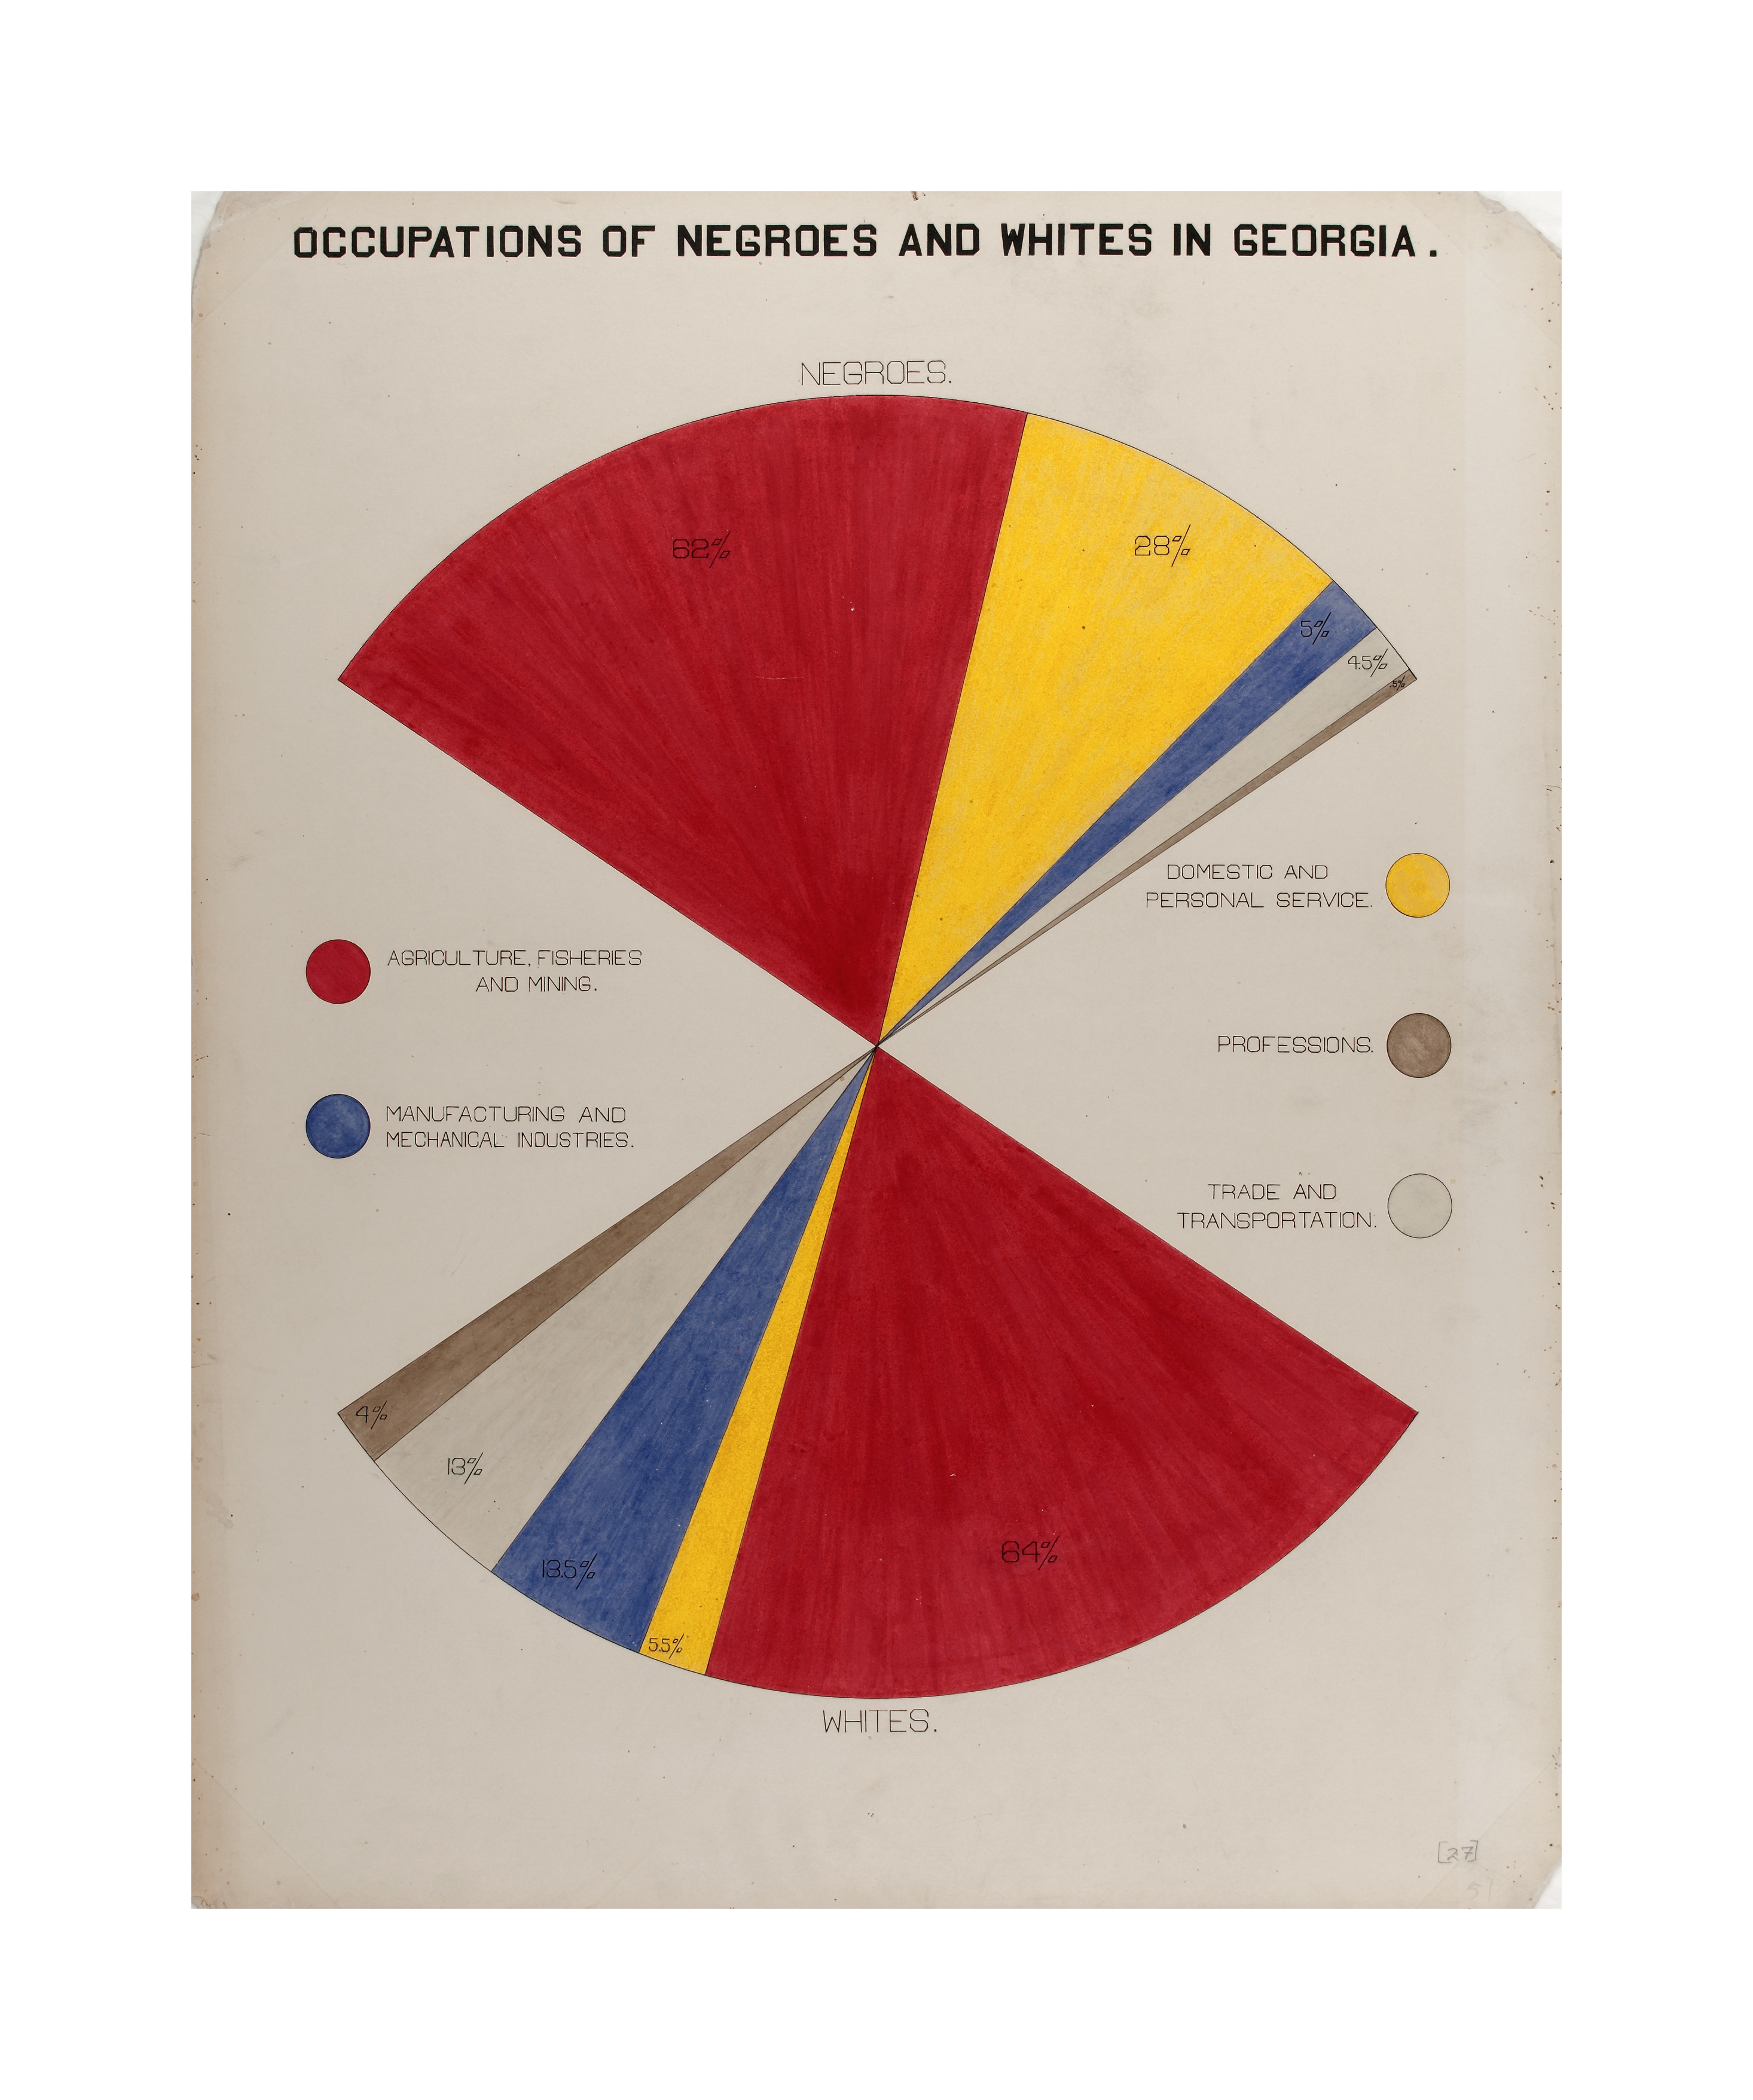
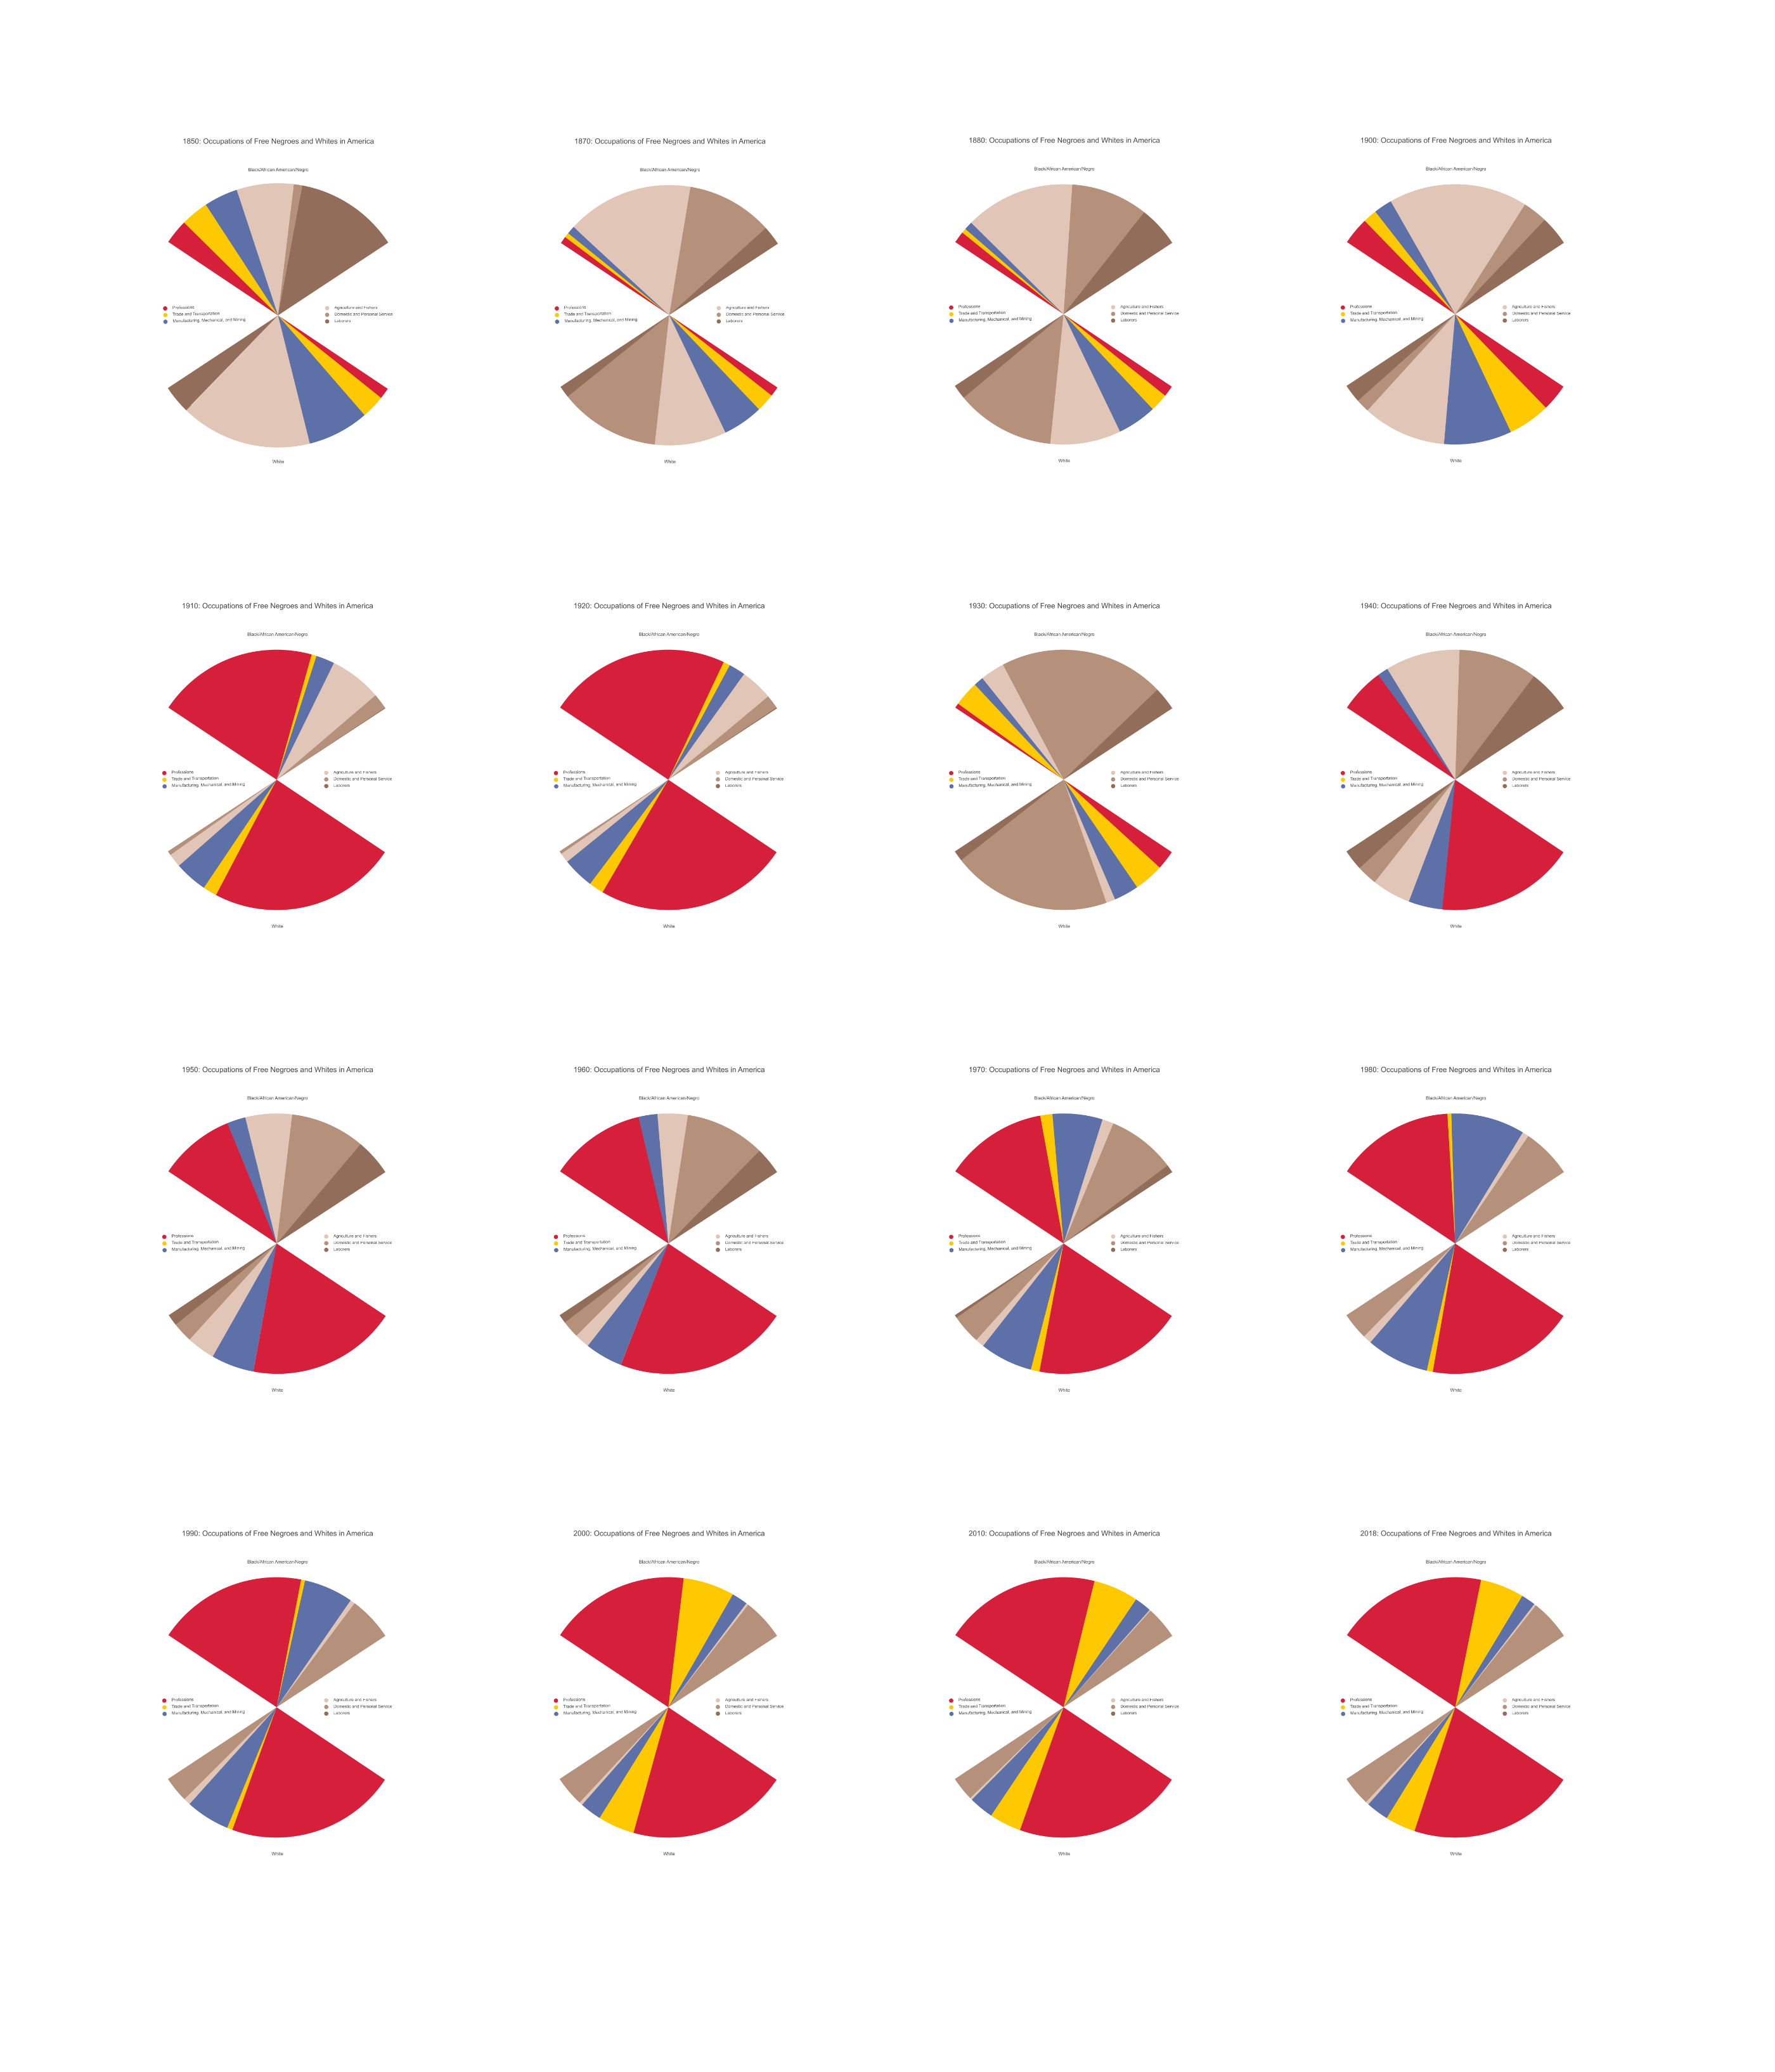
Their visualizations related to their occupation caught my attention. I found them fascinating. It is a passion of mine, and those visualizations were the most profound to me because they captured the equality between the Black and White communities. Our country's occupation and employment data dates back hundreds of years and is closely linked to census records, allowing for segmentation by ethnicity.
Library of Congress, Prints & Photographs Division, LC-DIG-ppmsca-33889
Remapping Occupations
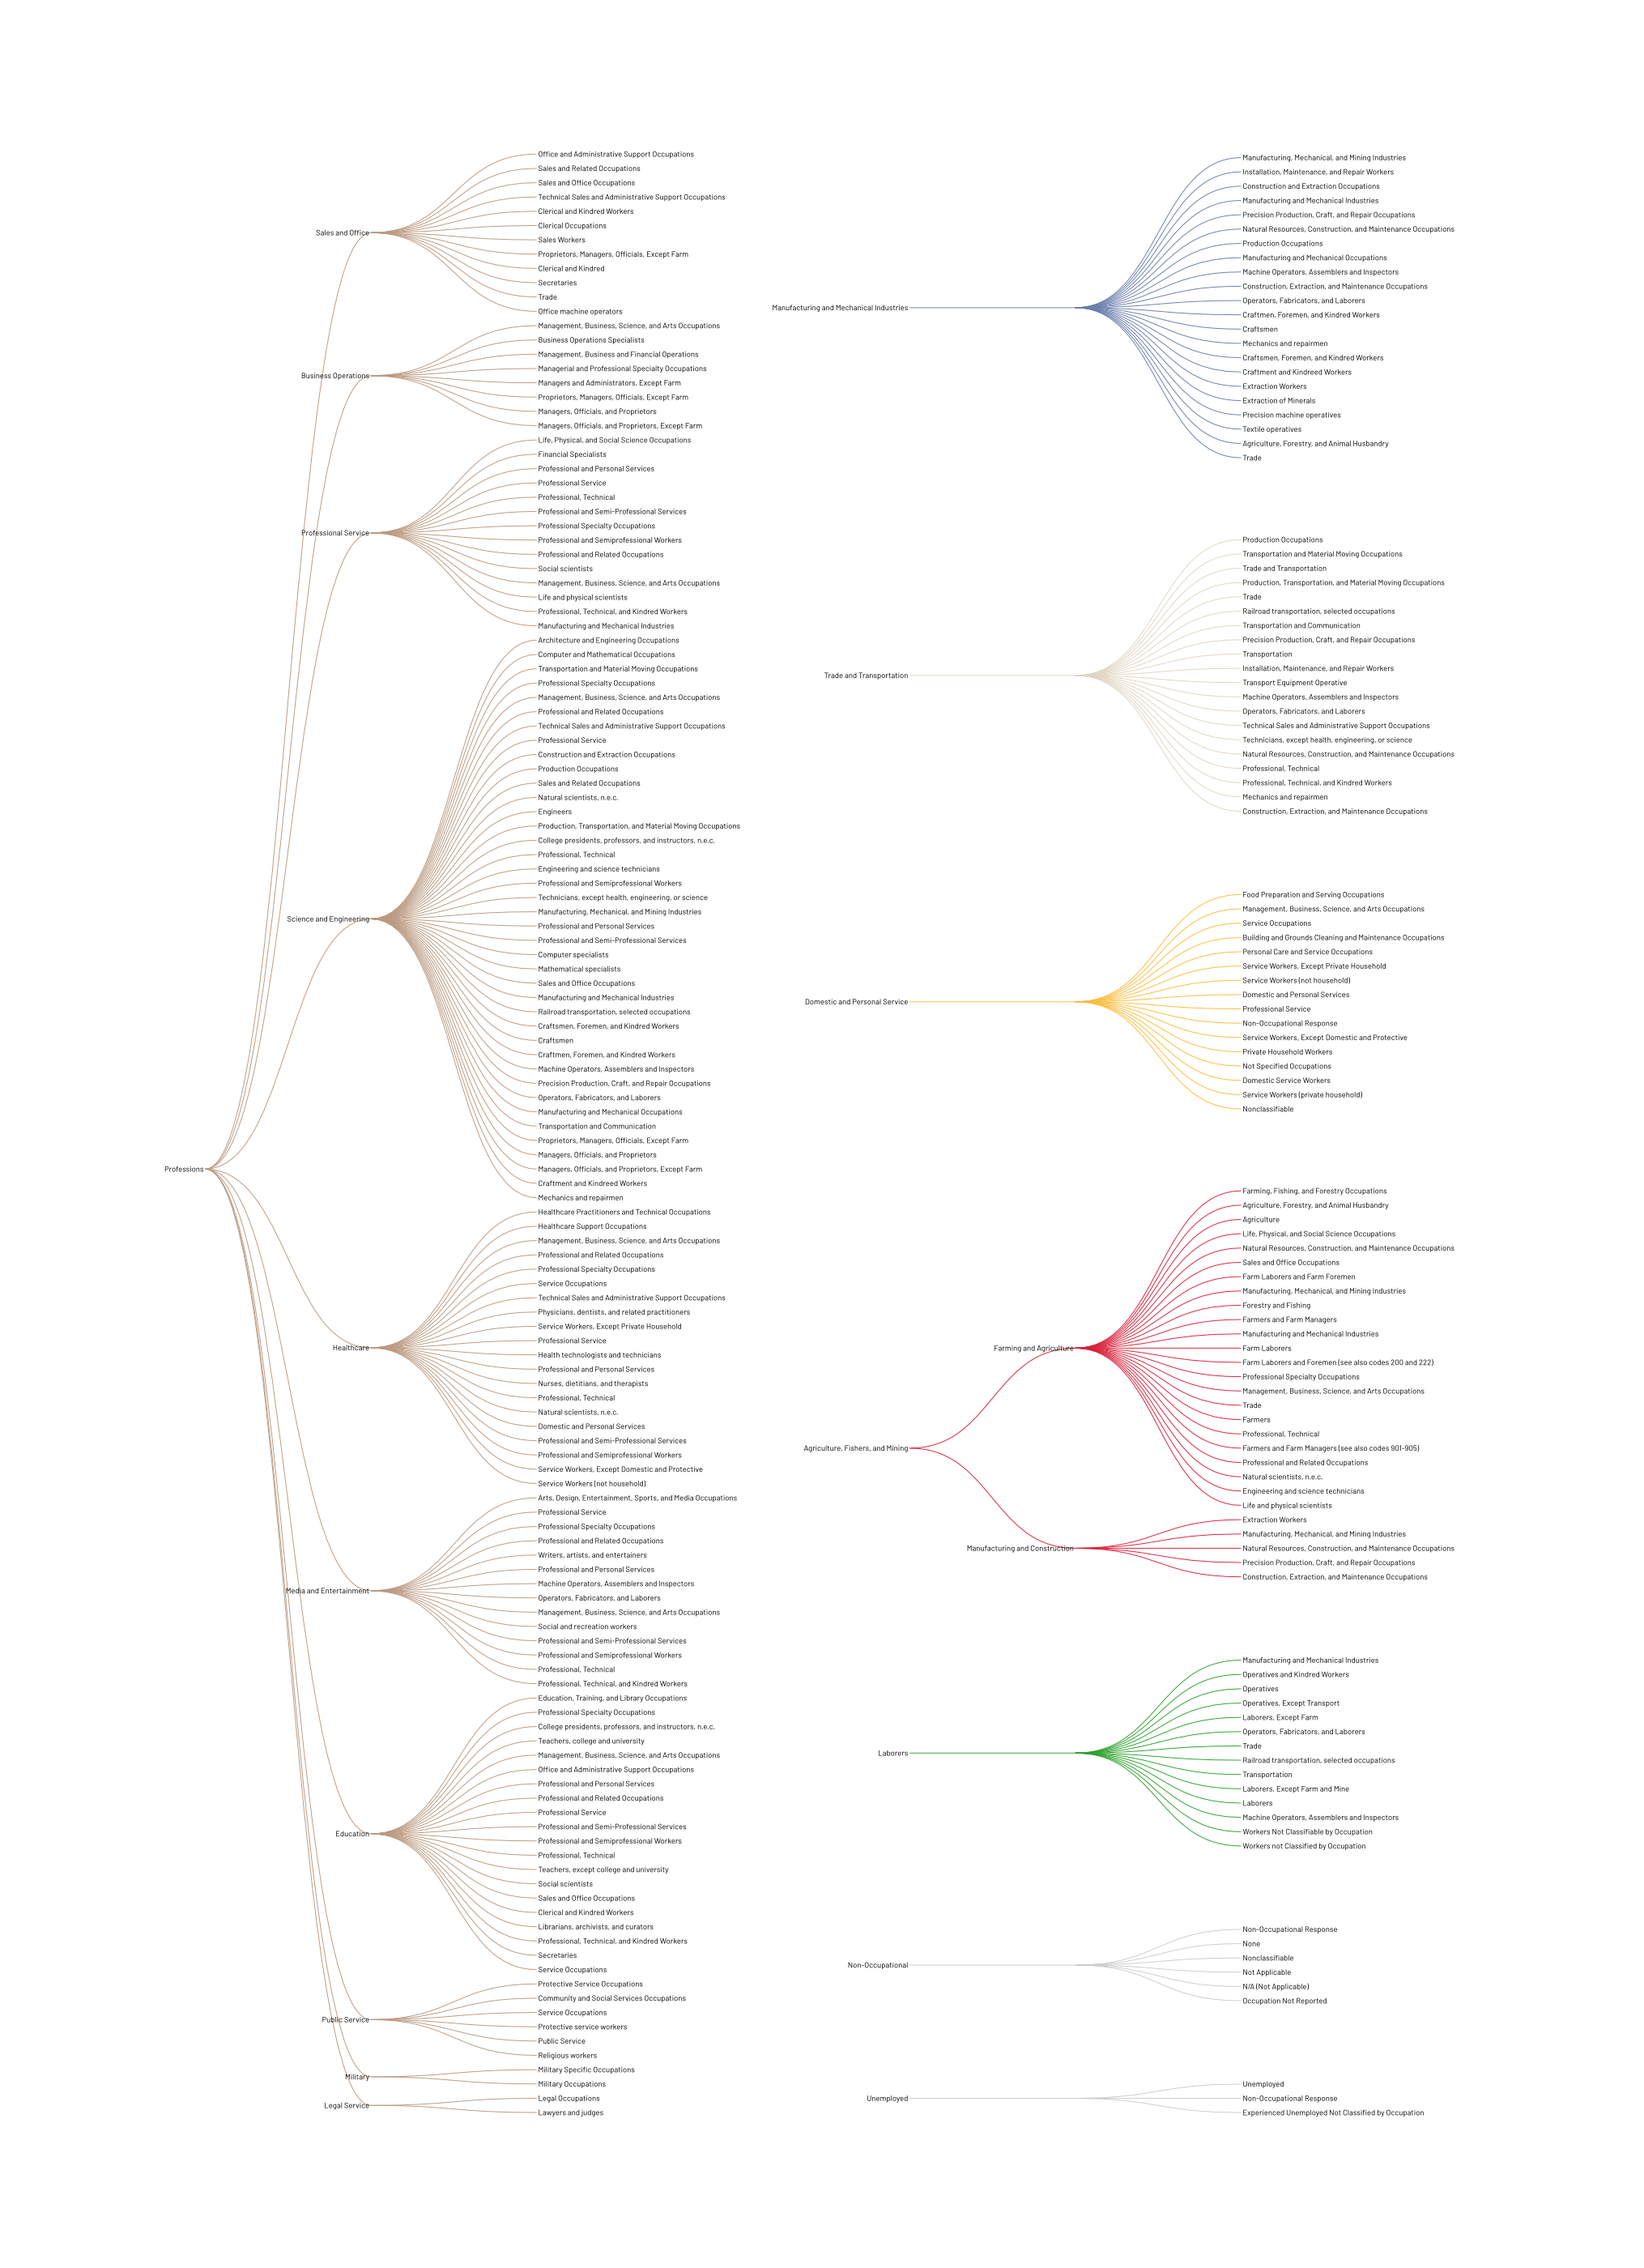
The Census Bureau has maintained its occupational codes since 1850. Industry and occupation data has been collected during decennial censuses continuously since 1910 using the American Community Survey. My challenge was mapping industry and occupation data from 1850 to 2010. It's not perfect, but I recode the occupational categories to align more with those in W.E.B. Du Bois’s visualizations and preserve his original perspective while integrating it with modern data. Remapping the data helped keep the visual style consistent while allowing today’s data to shine and show how it changed over time.
Library of Congress, Prints & Photographs Division, LC-USZ62-118030
Job titles fit into three or four hierarchical levels, with occupational titles (e.g., Craftsman) being the most granular. Many job titles remained consistent, while others were added and matured. The higher-level categories only changed slightly except when a significant shift happened in society due to technological advancement. Combining job titles with their consistent hierarchical types allowed me to group occupational titles from 1850 to 2018.
Segmented Analysis
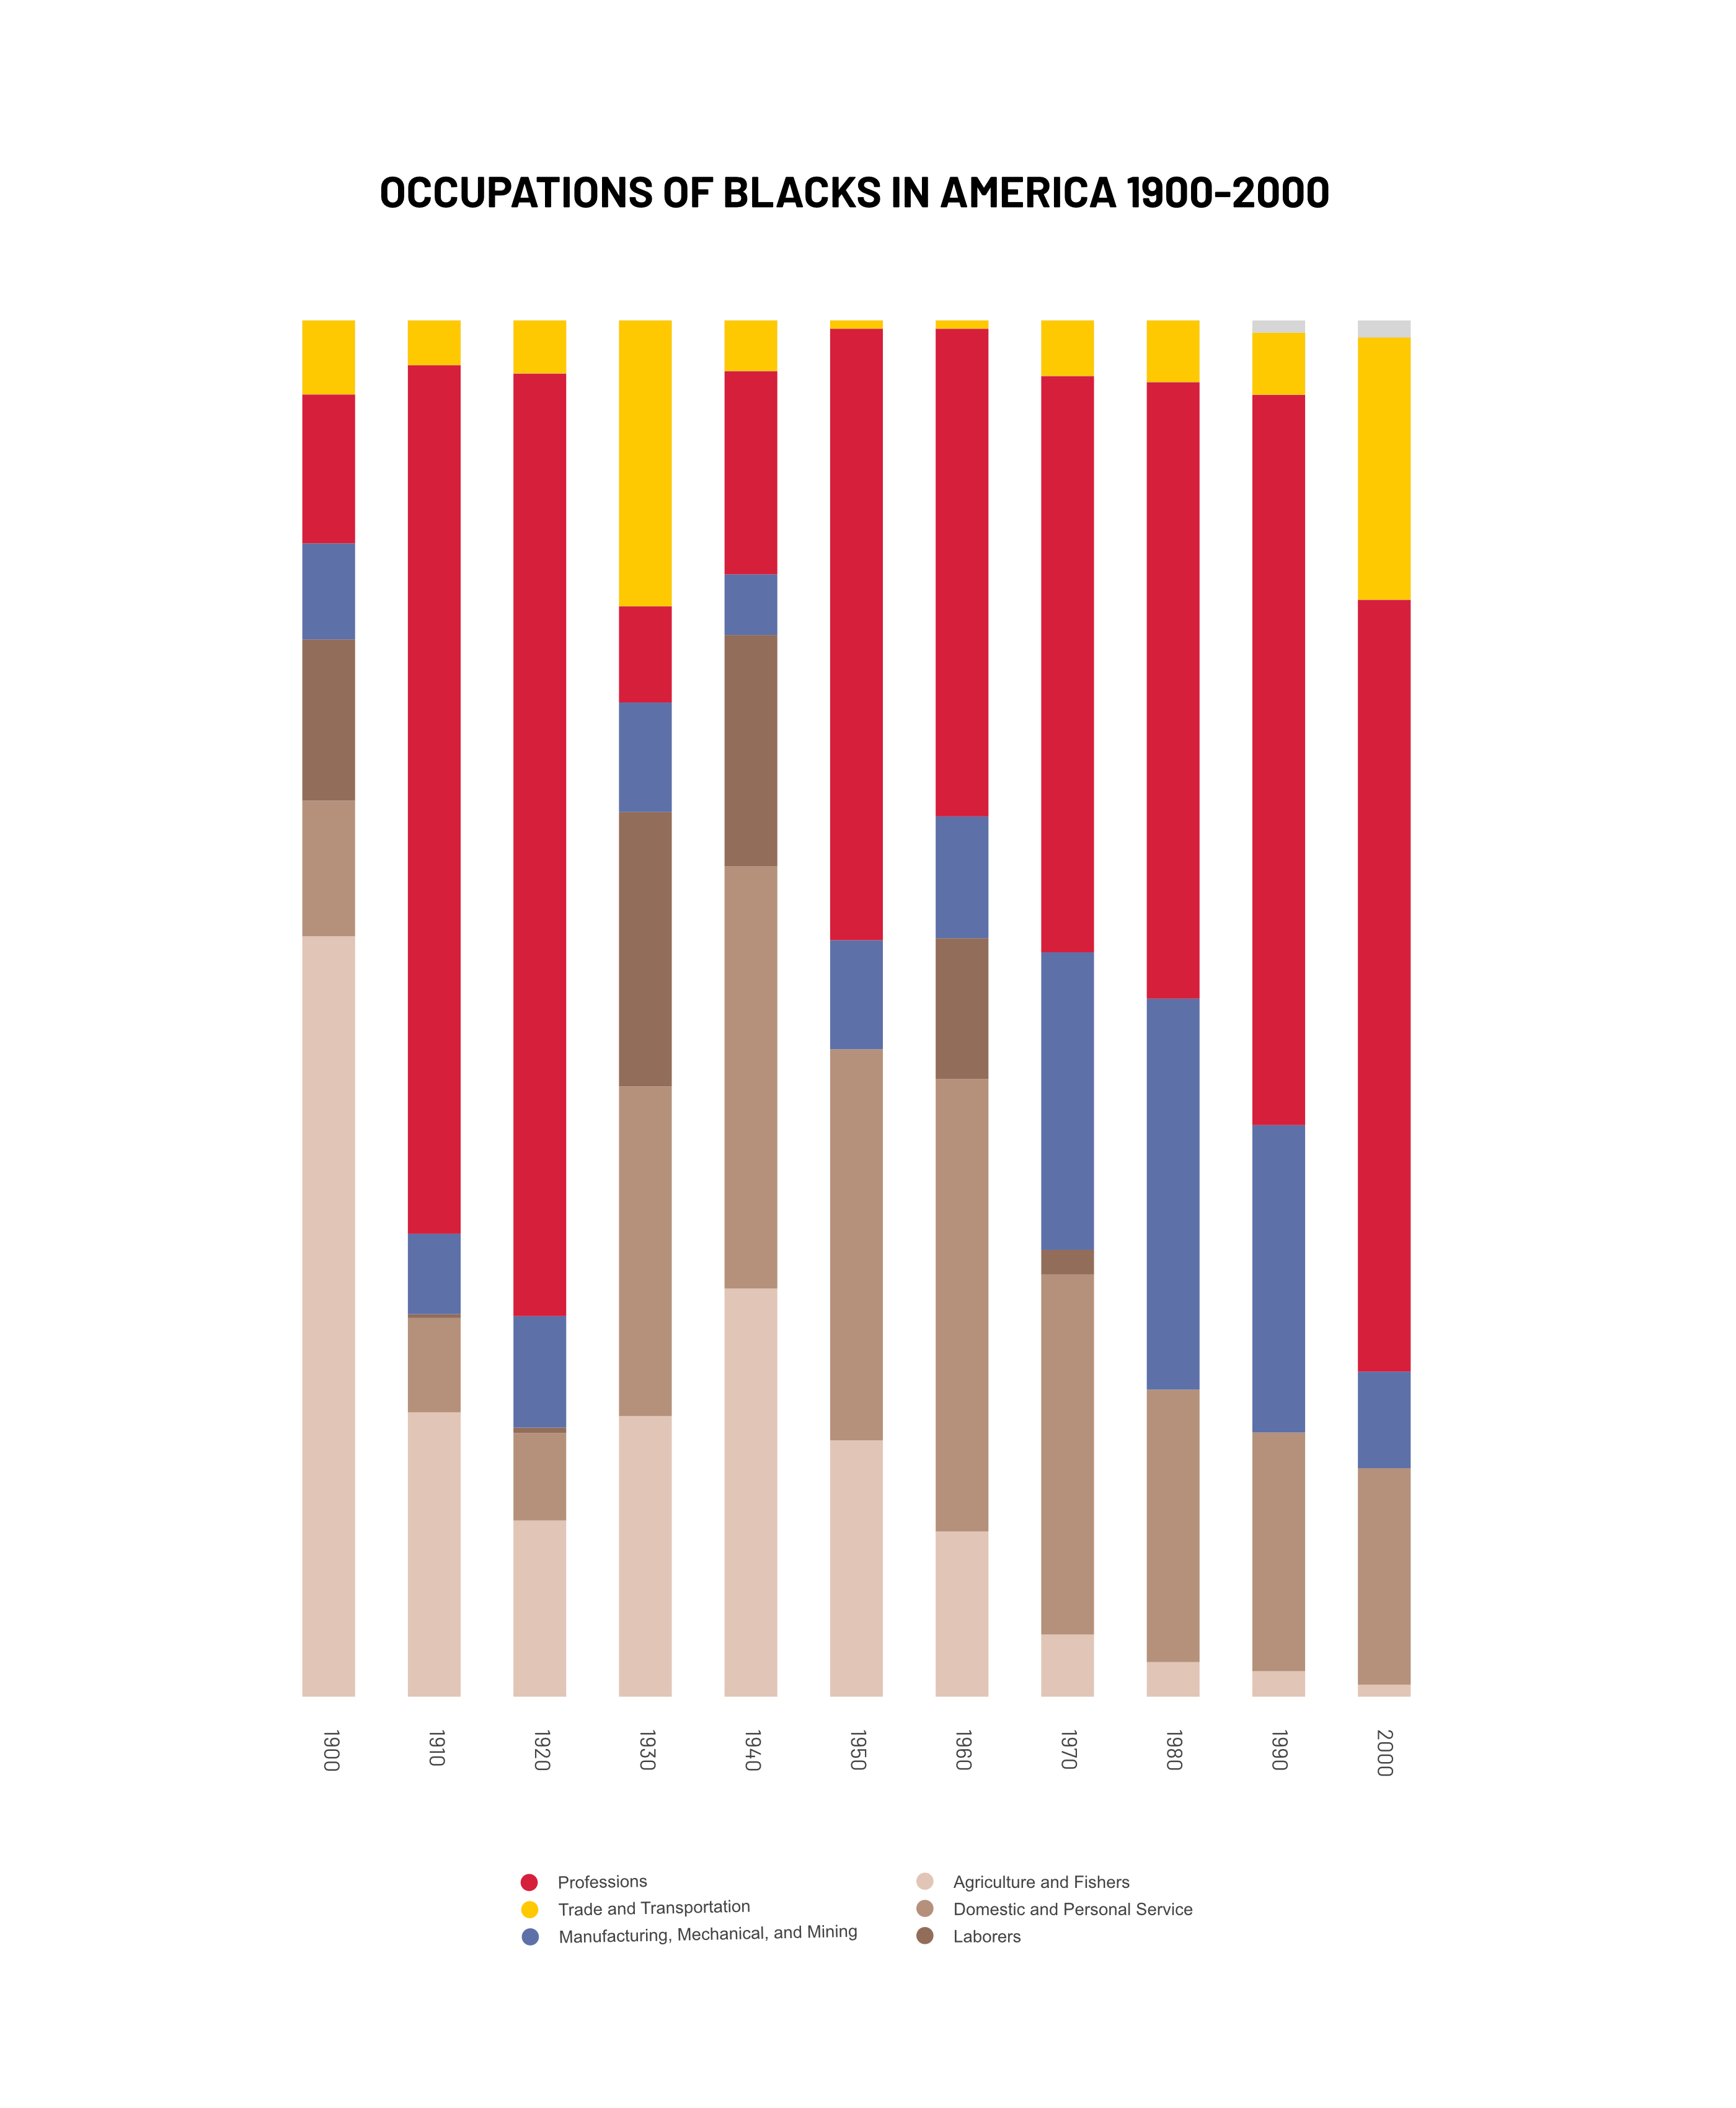
The final dataset was then divided into demographic segments (e.g., industry, sex, race, state, year, decade, and custom job type) to reduce computational processing and make aggregation easier. These segments allowed the data to be analyzed utilizing different combinations. W.E.B. Du Bois used percentages of each race to show the overall distribution of workers in each occupation, so I continued with the same visual framework and intent.
This old graph
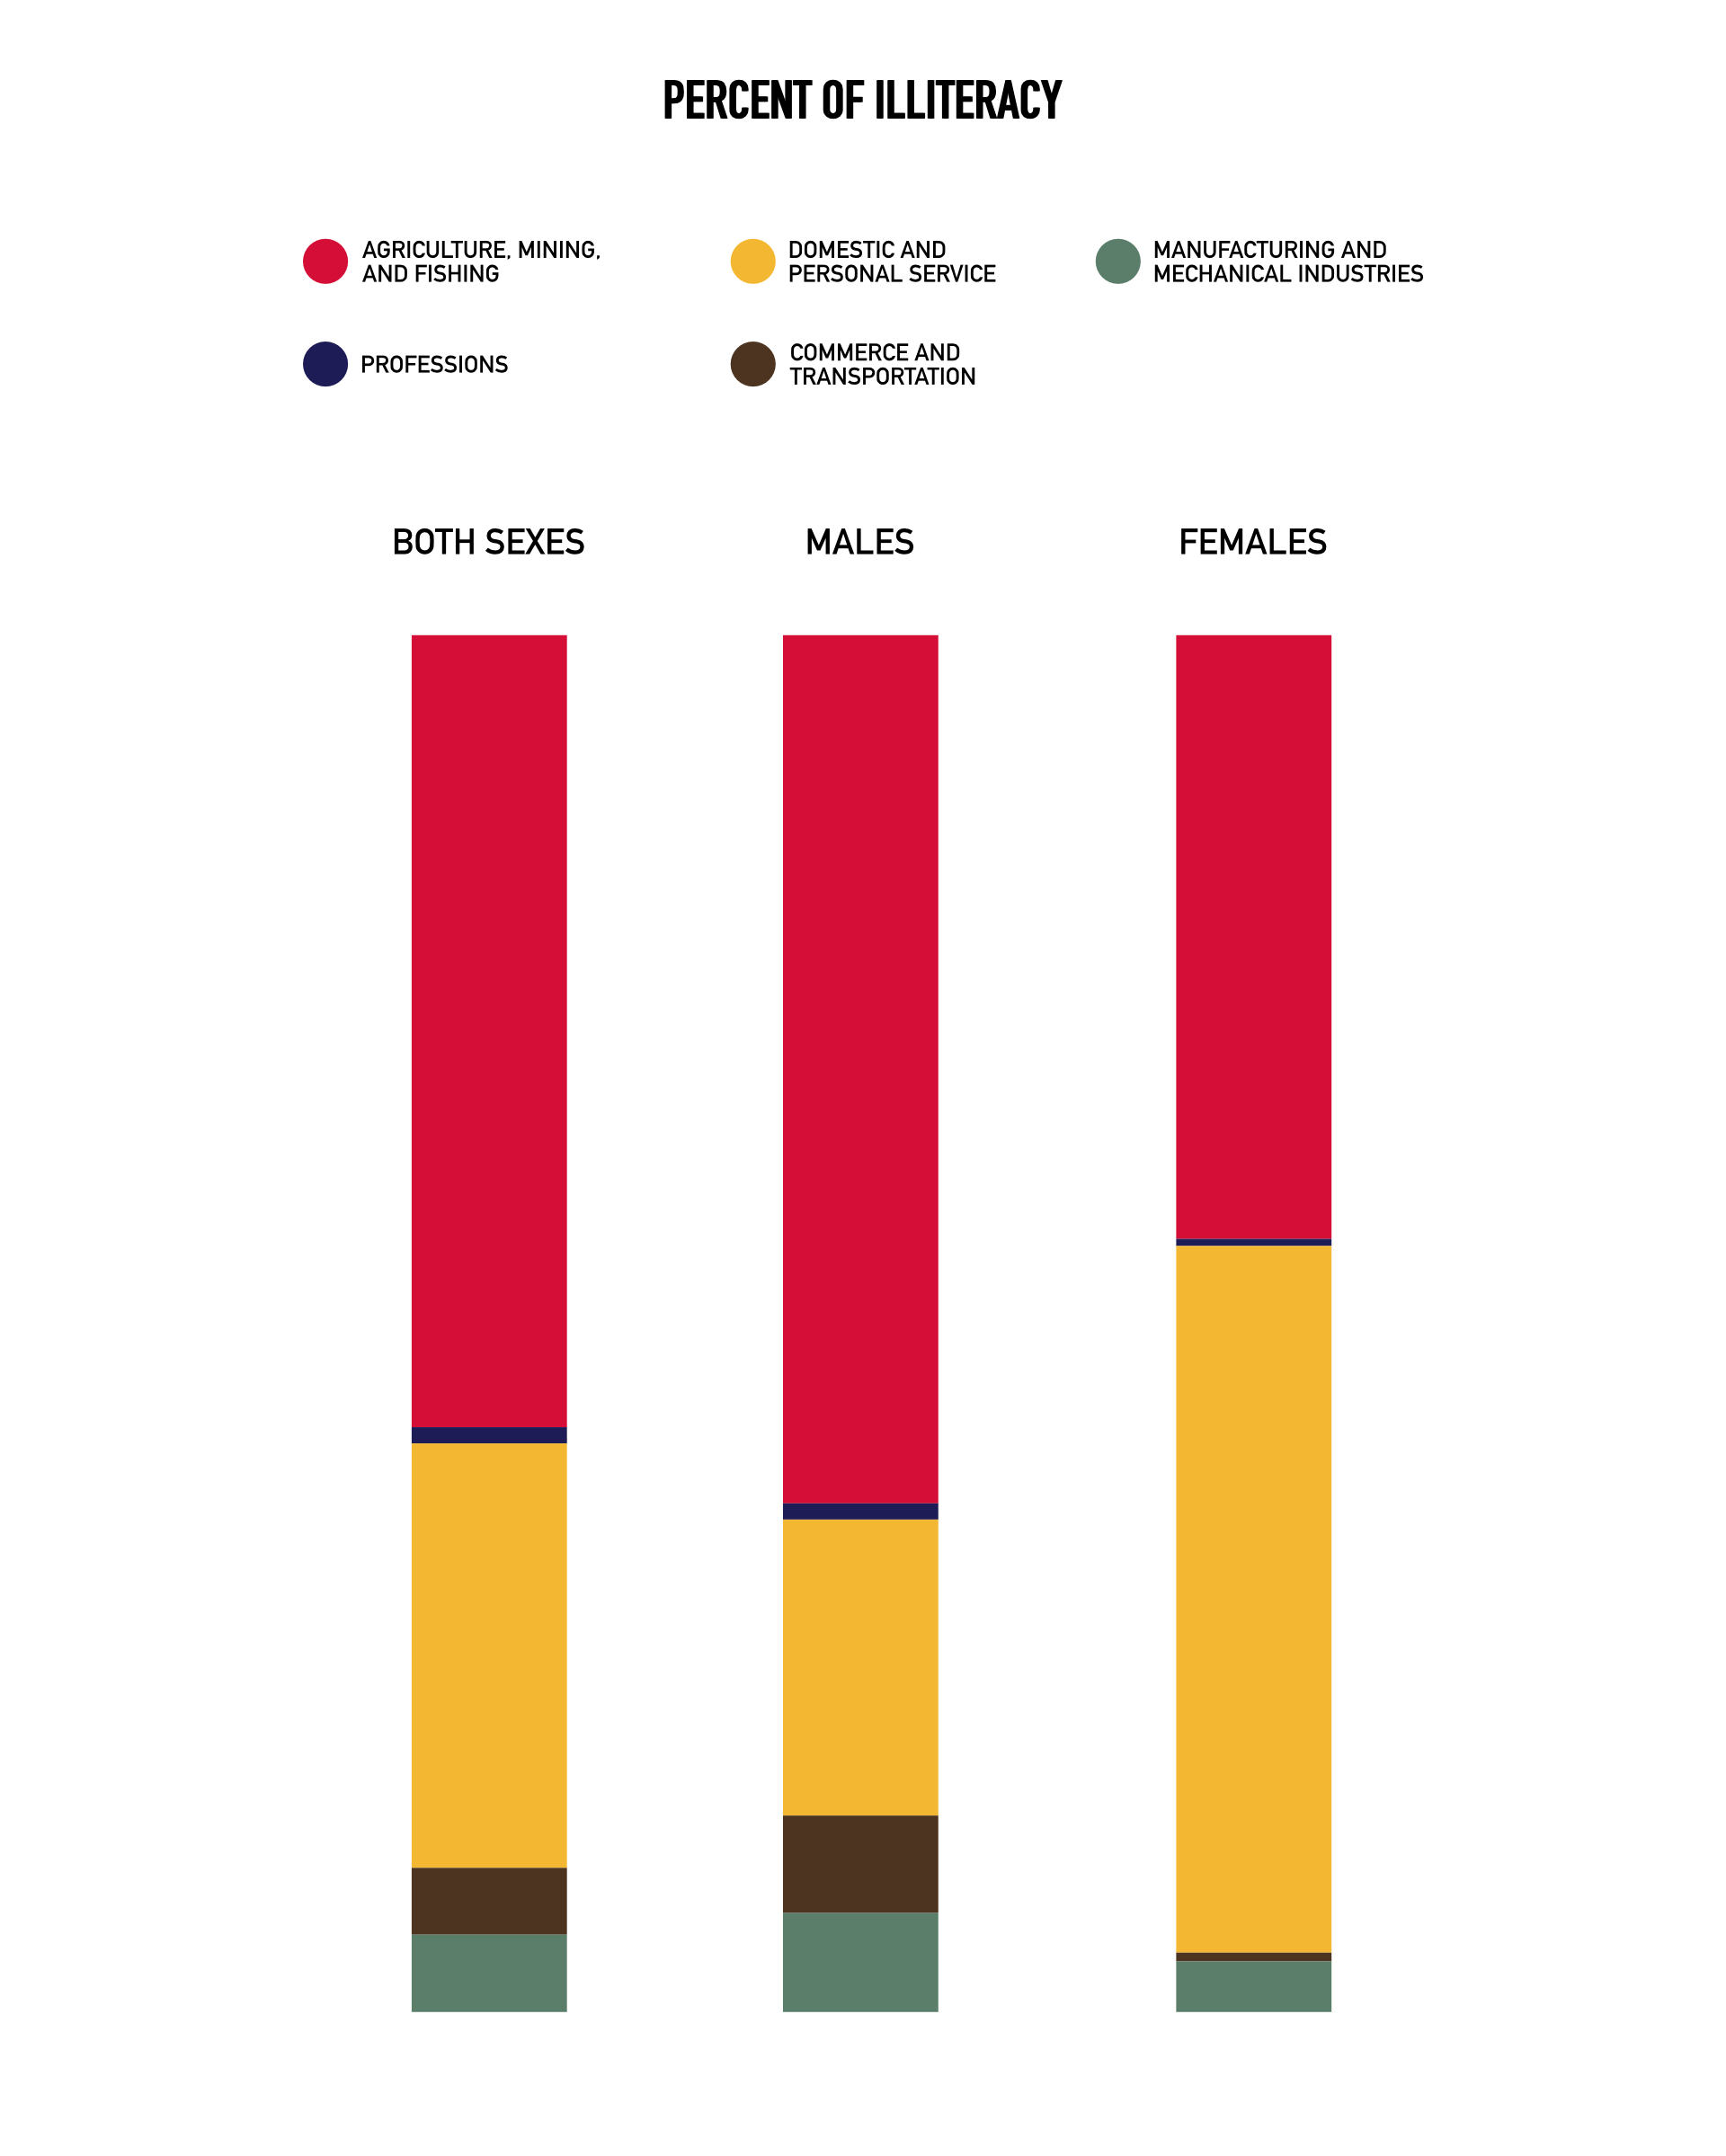
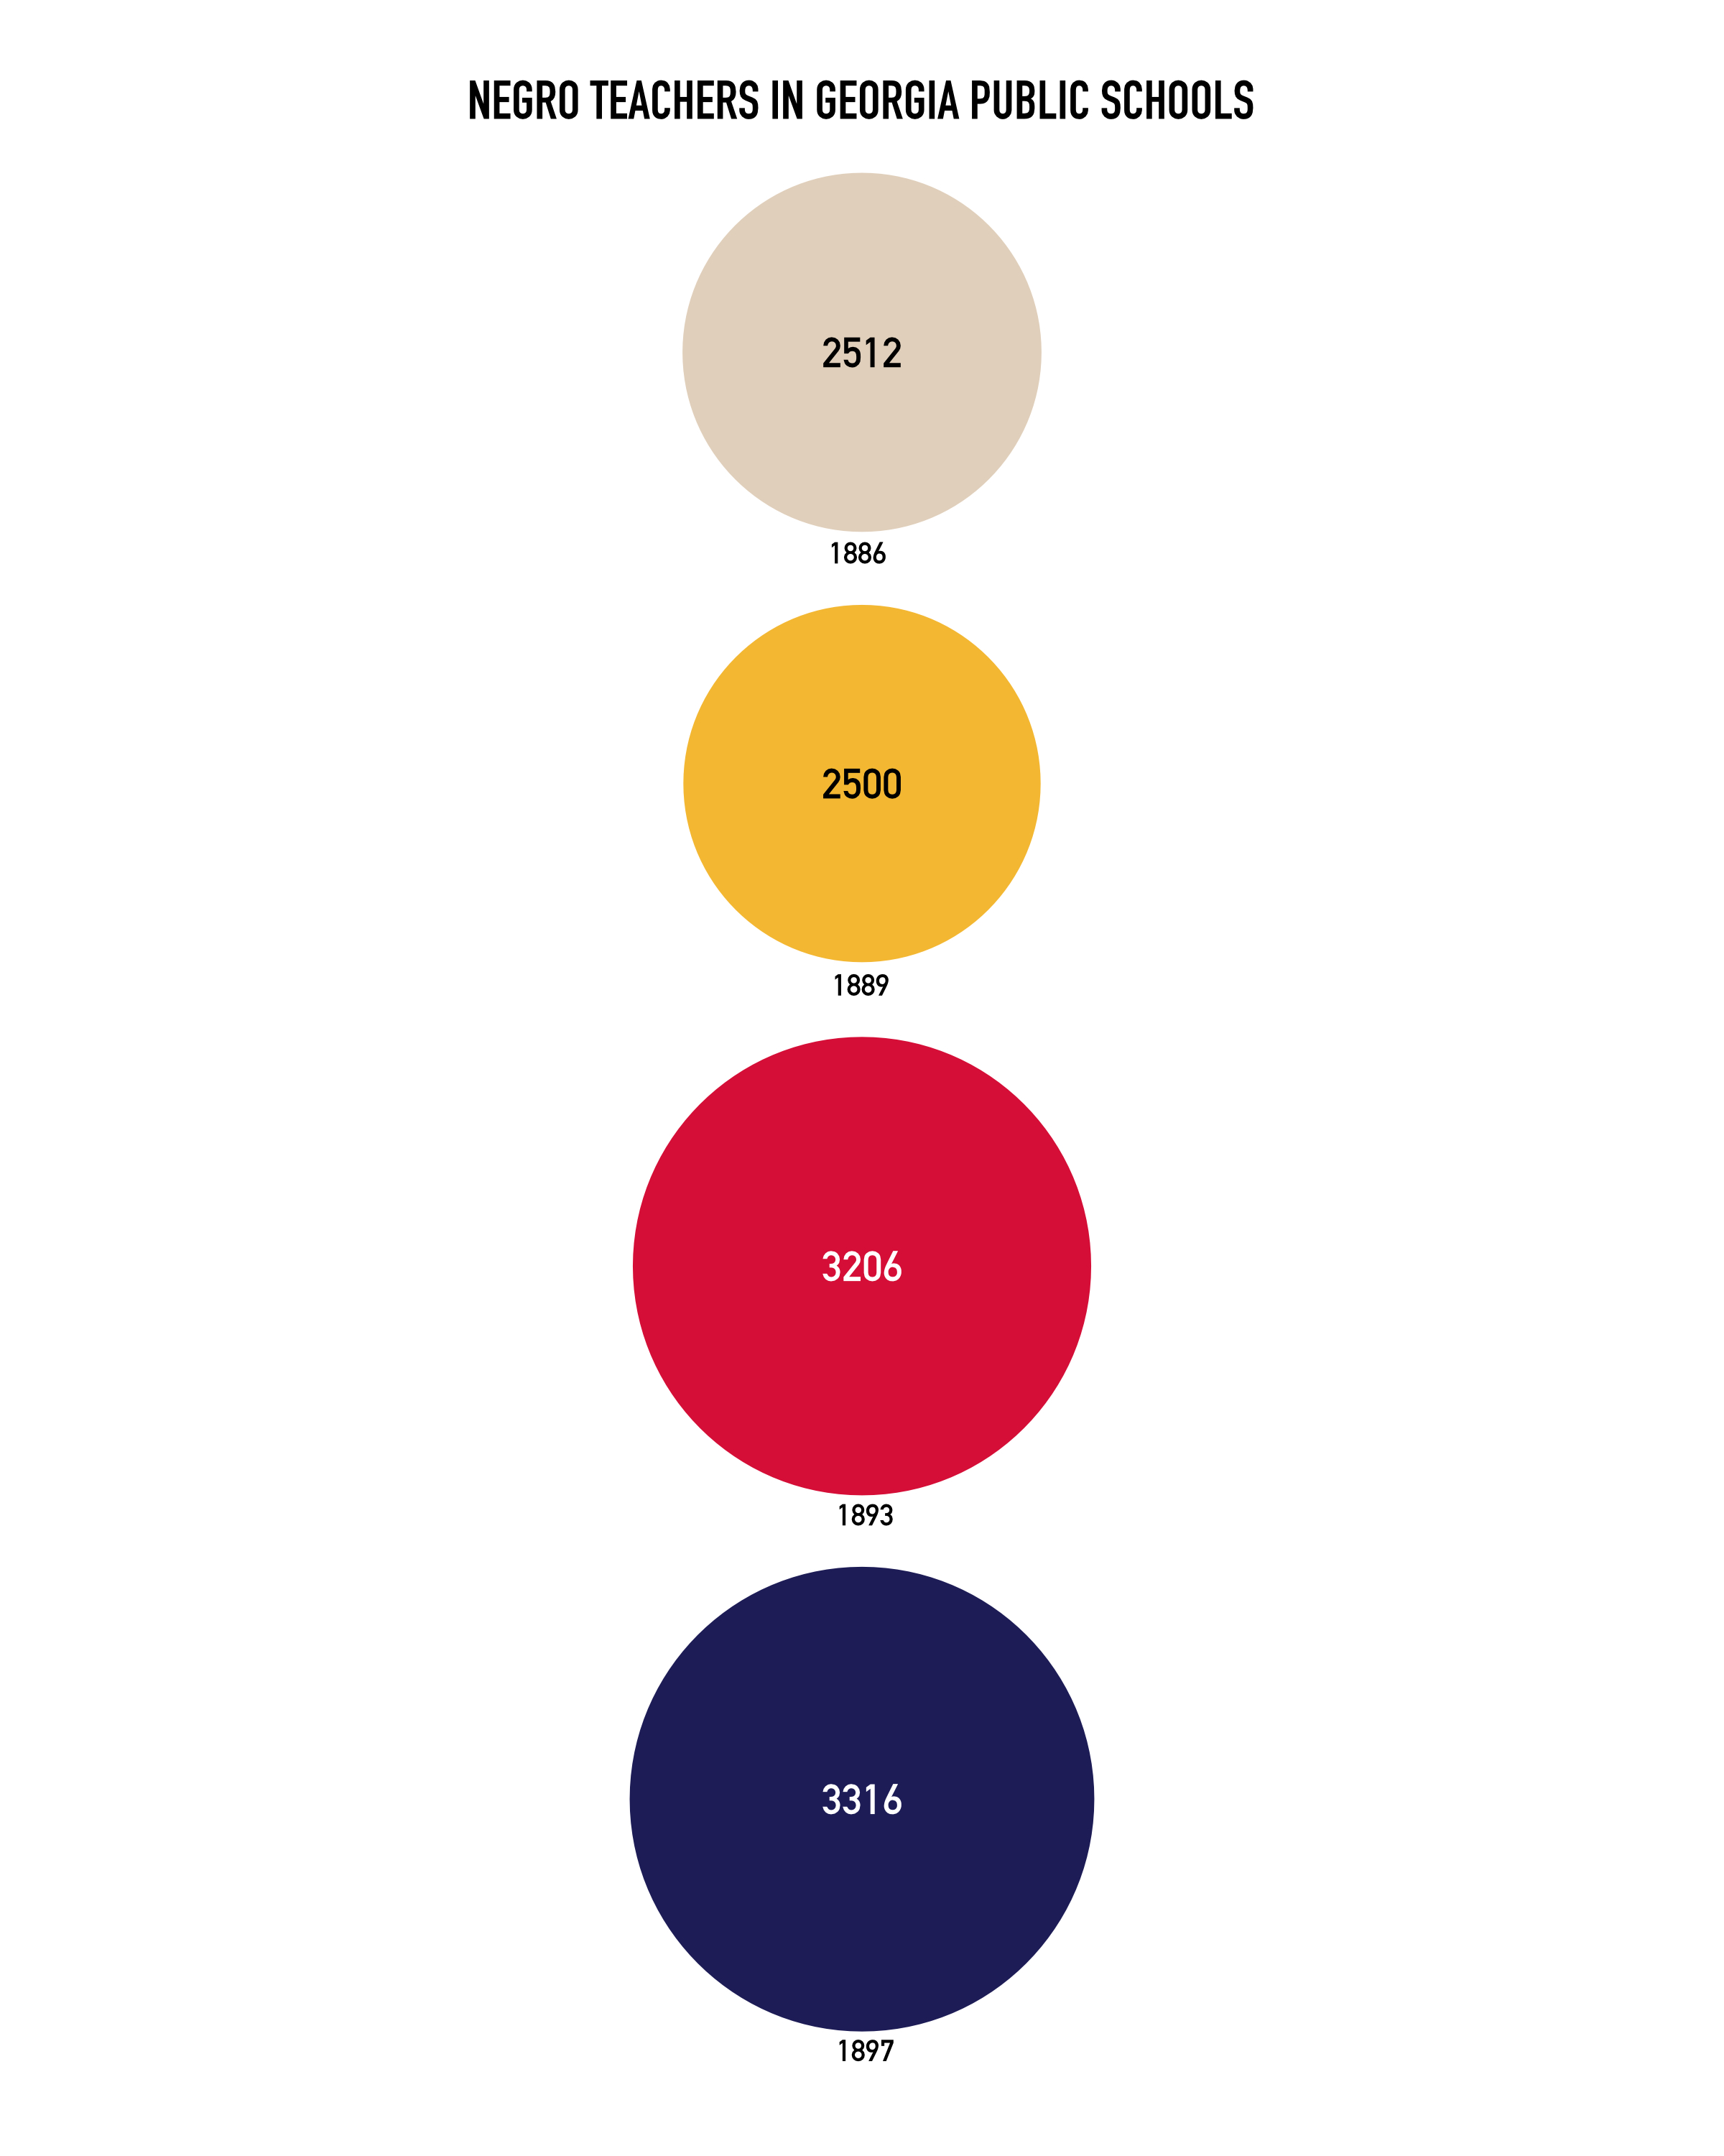
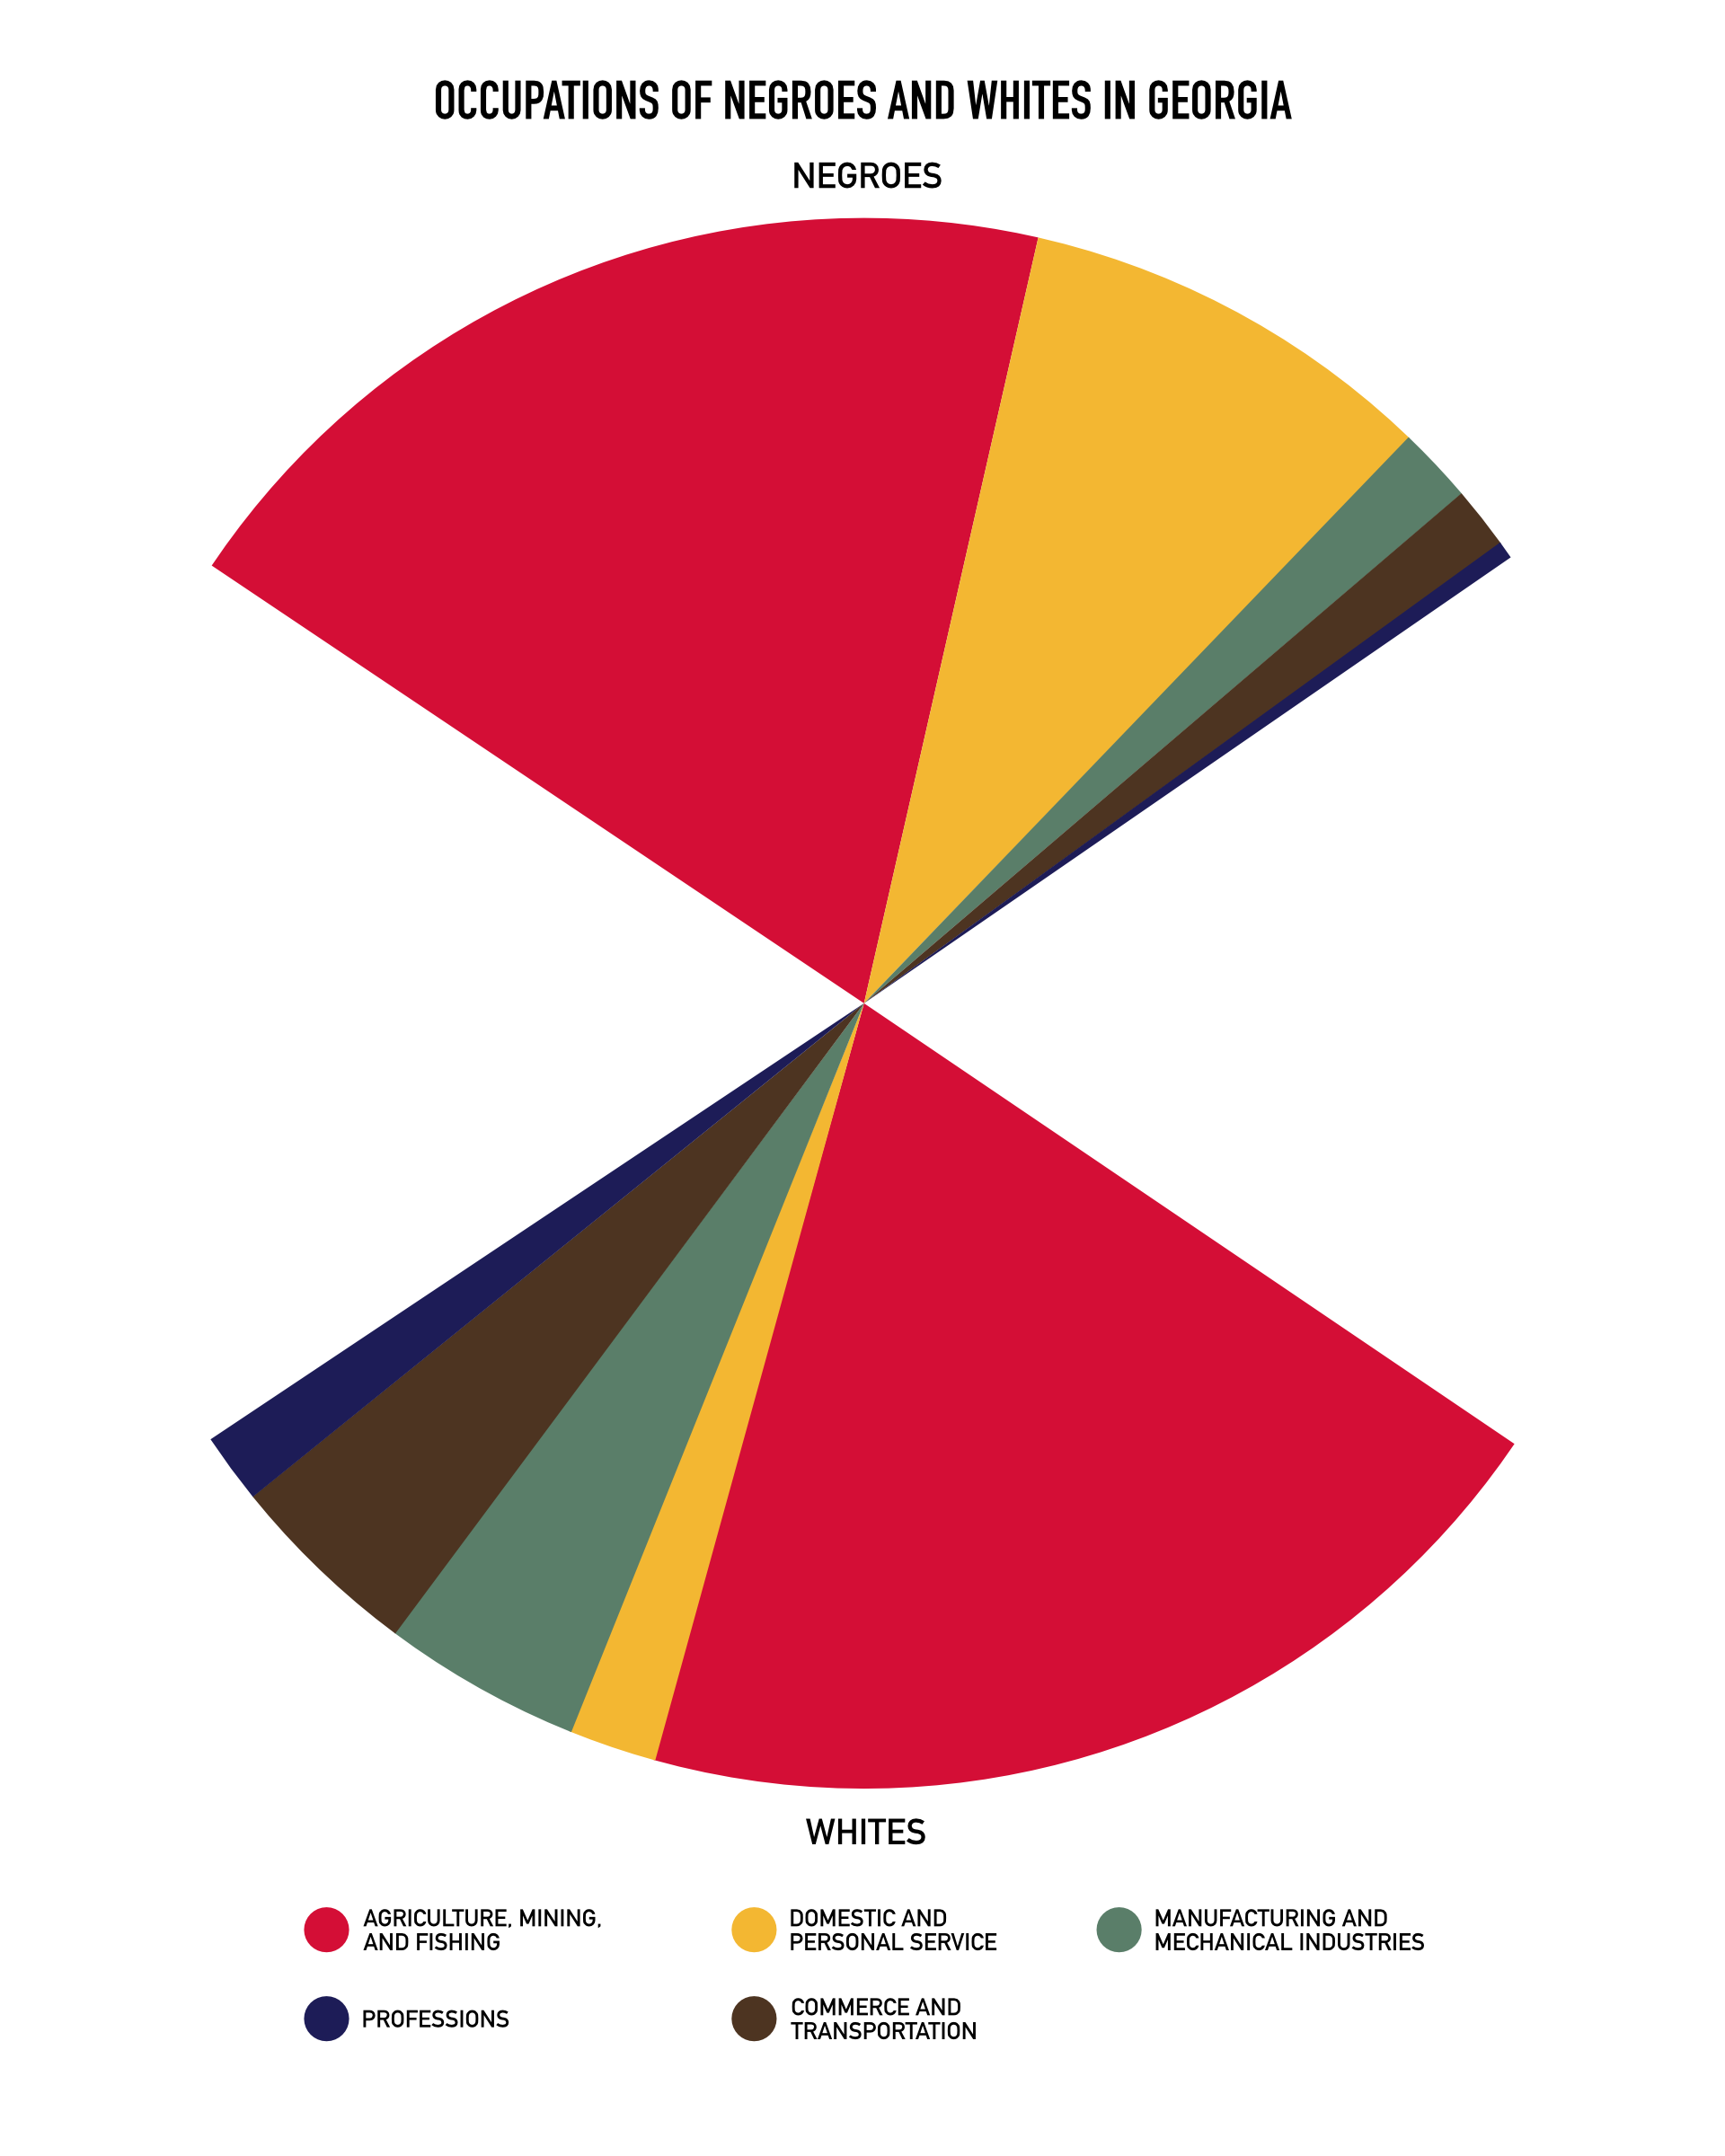
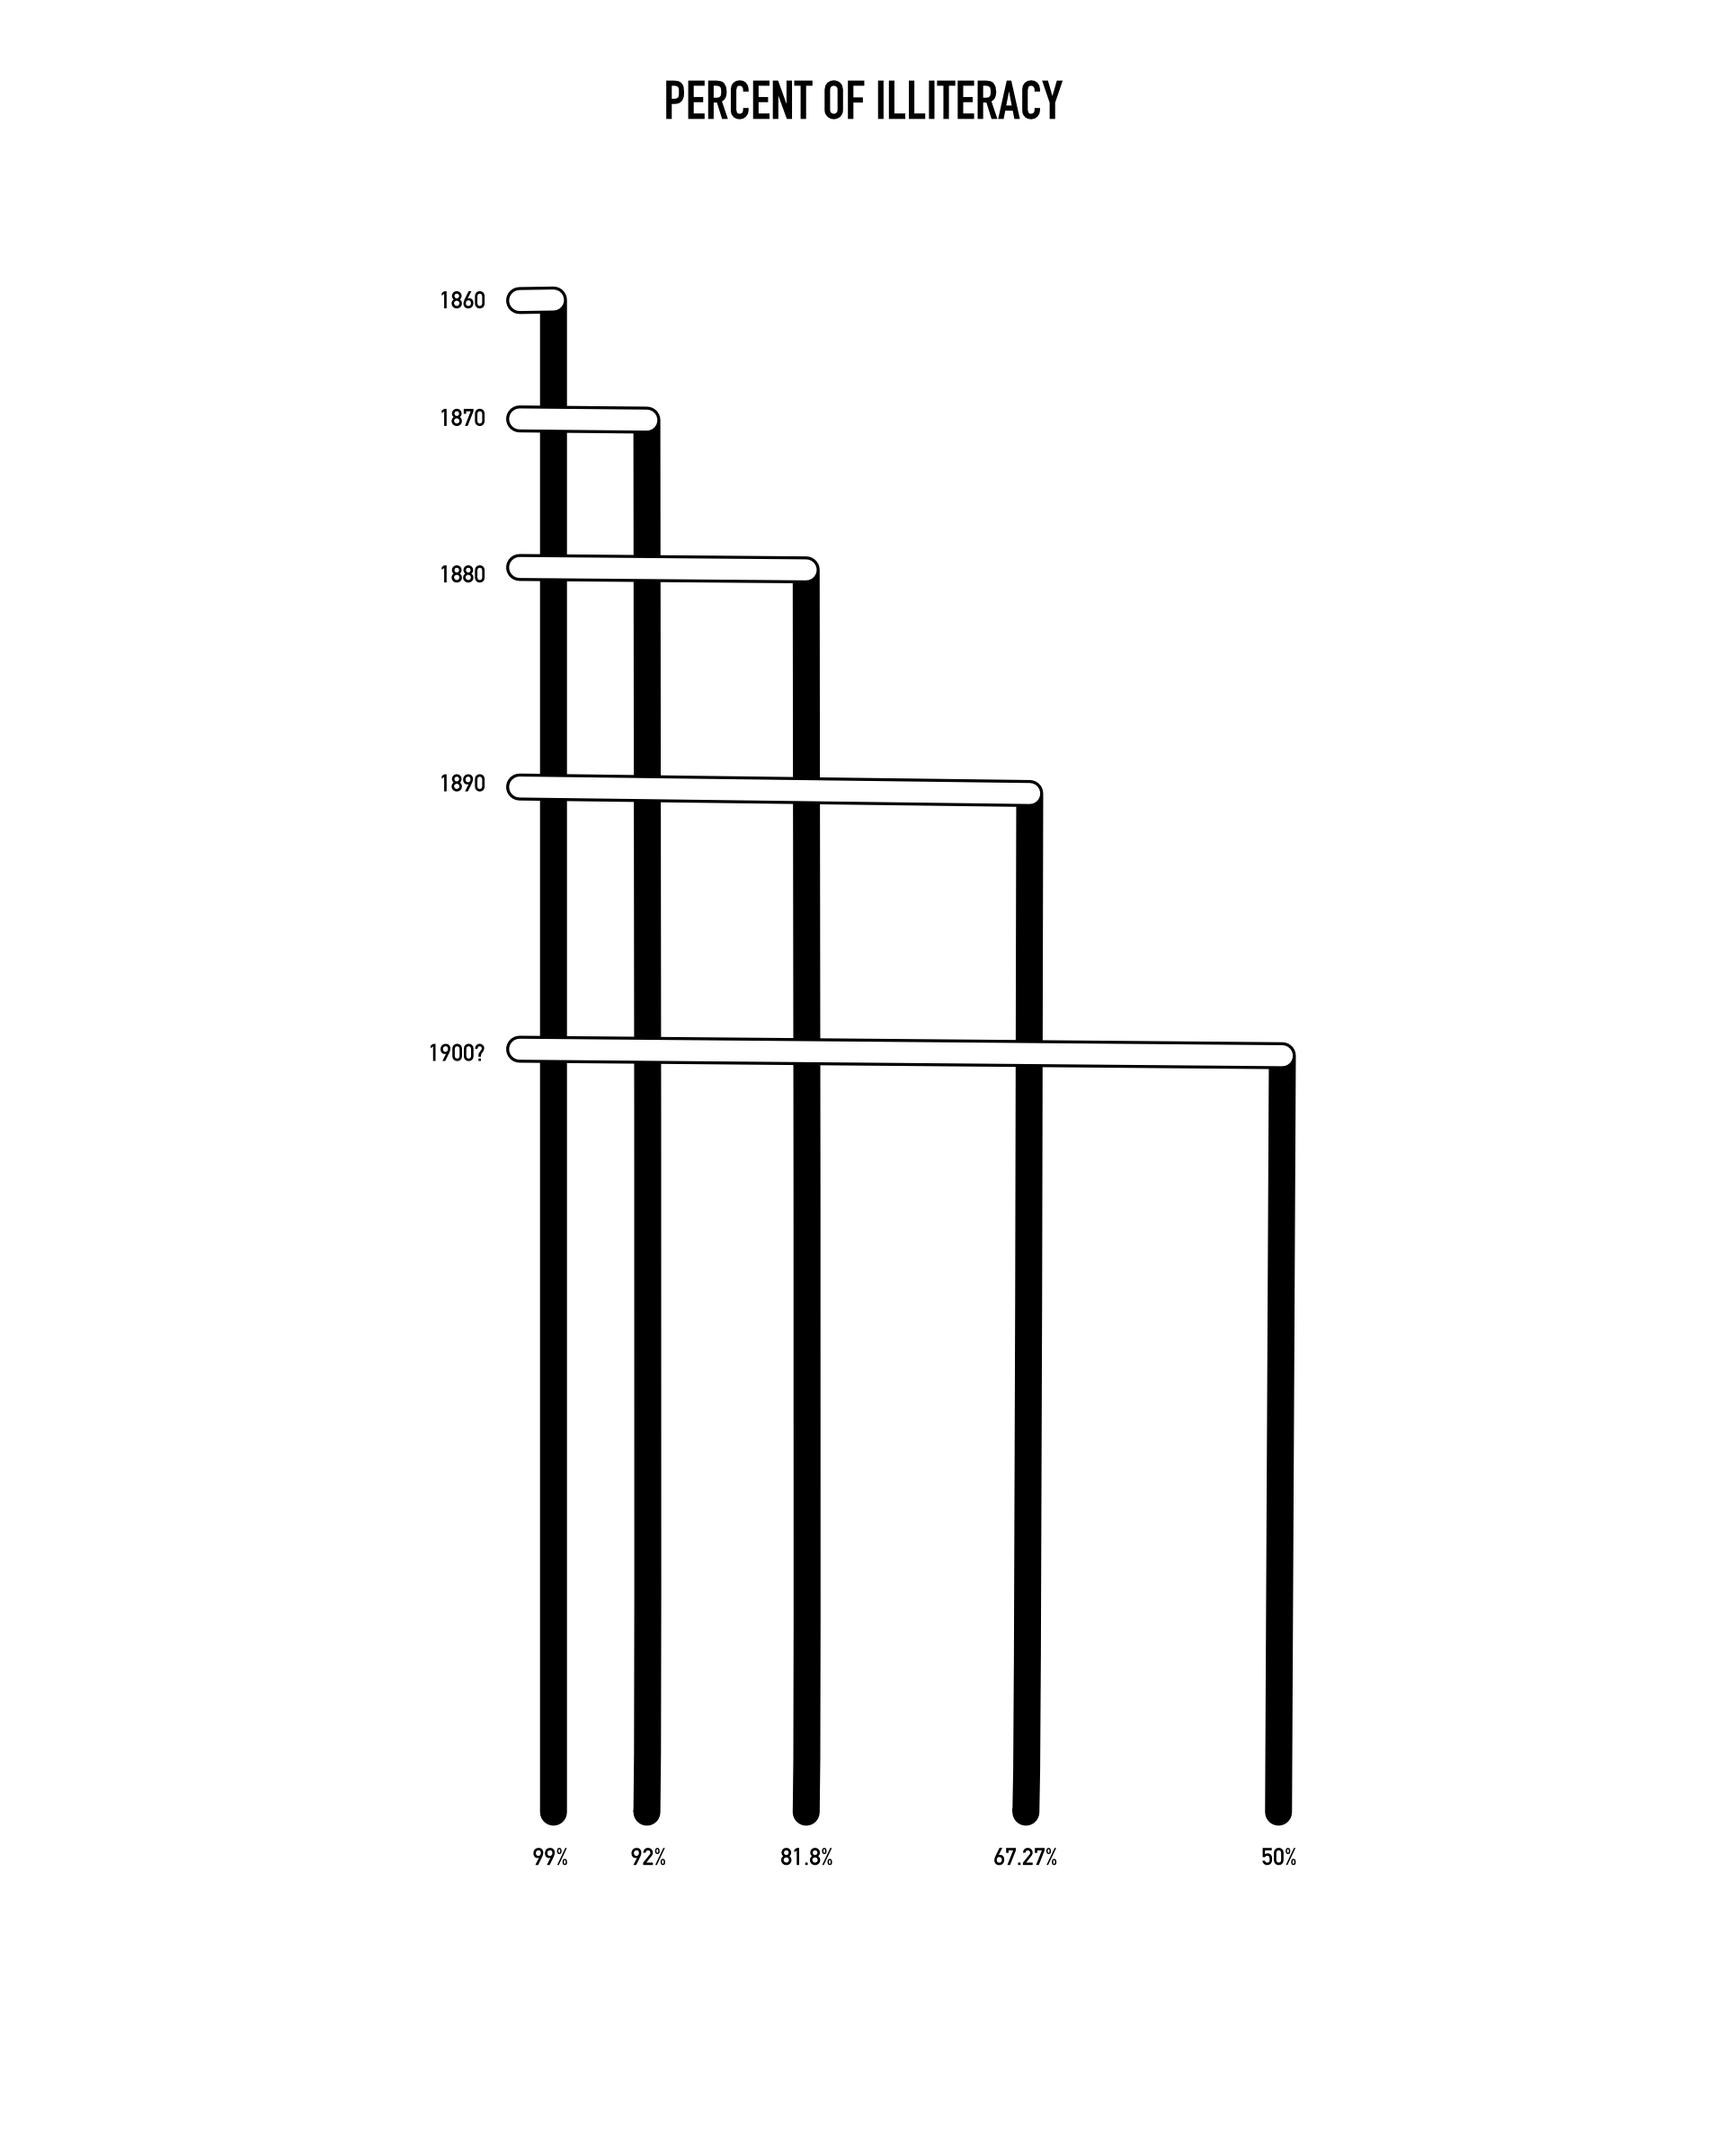
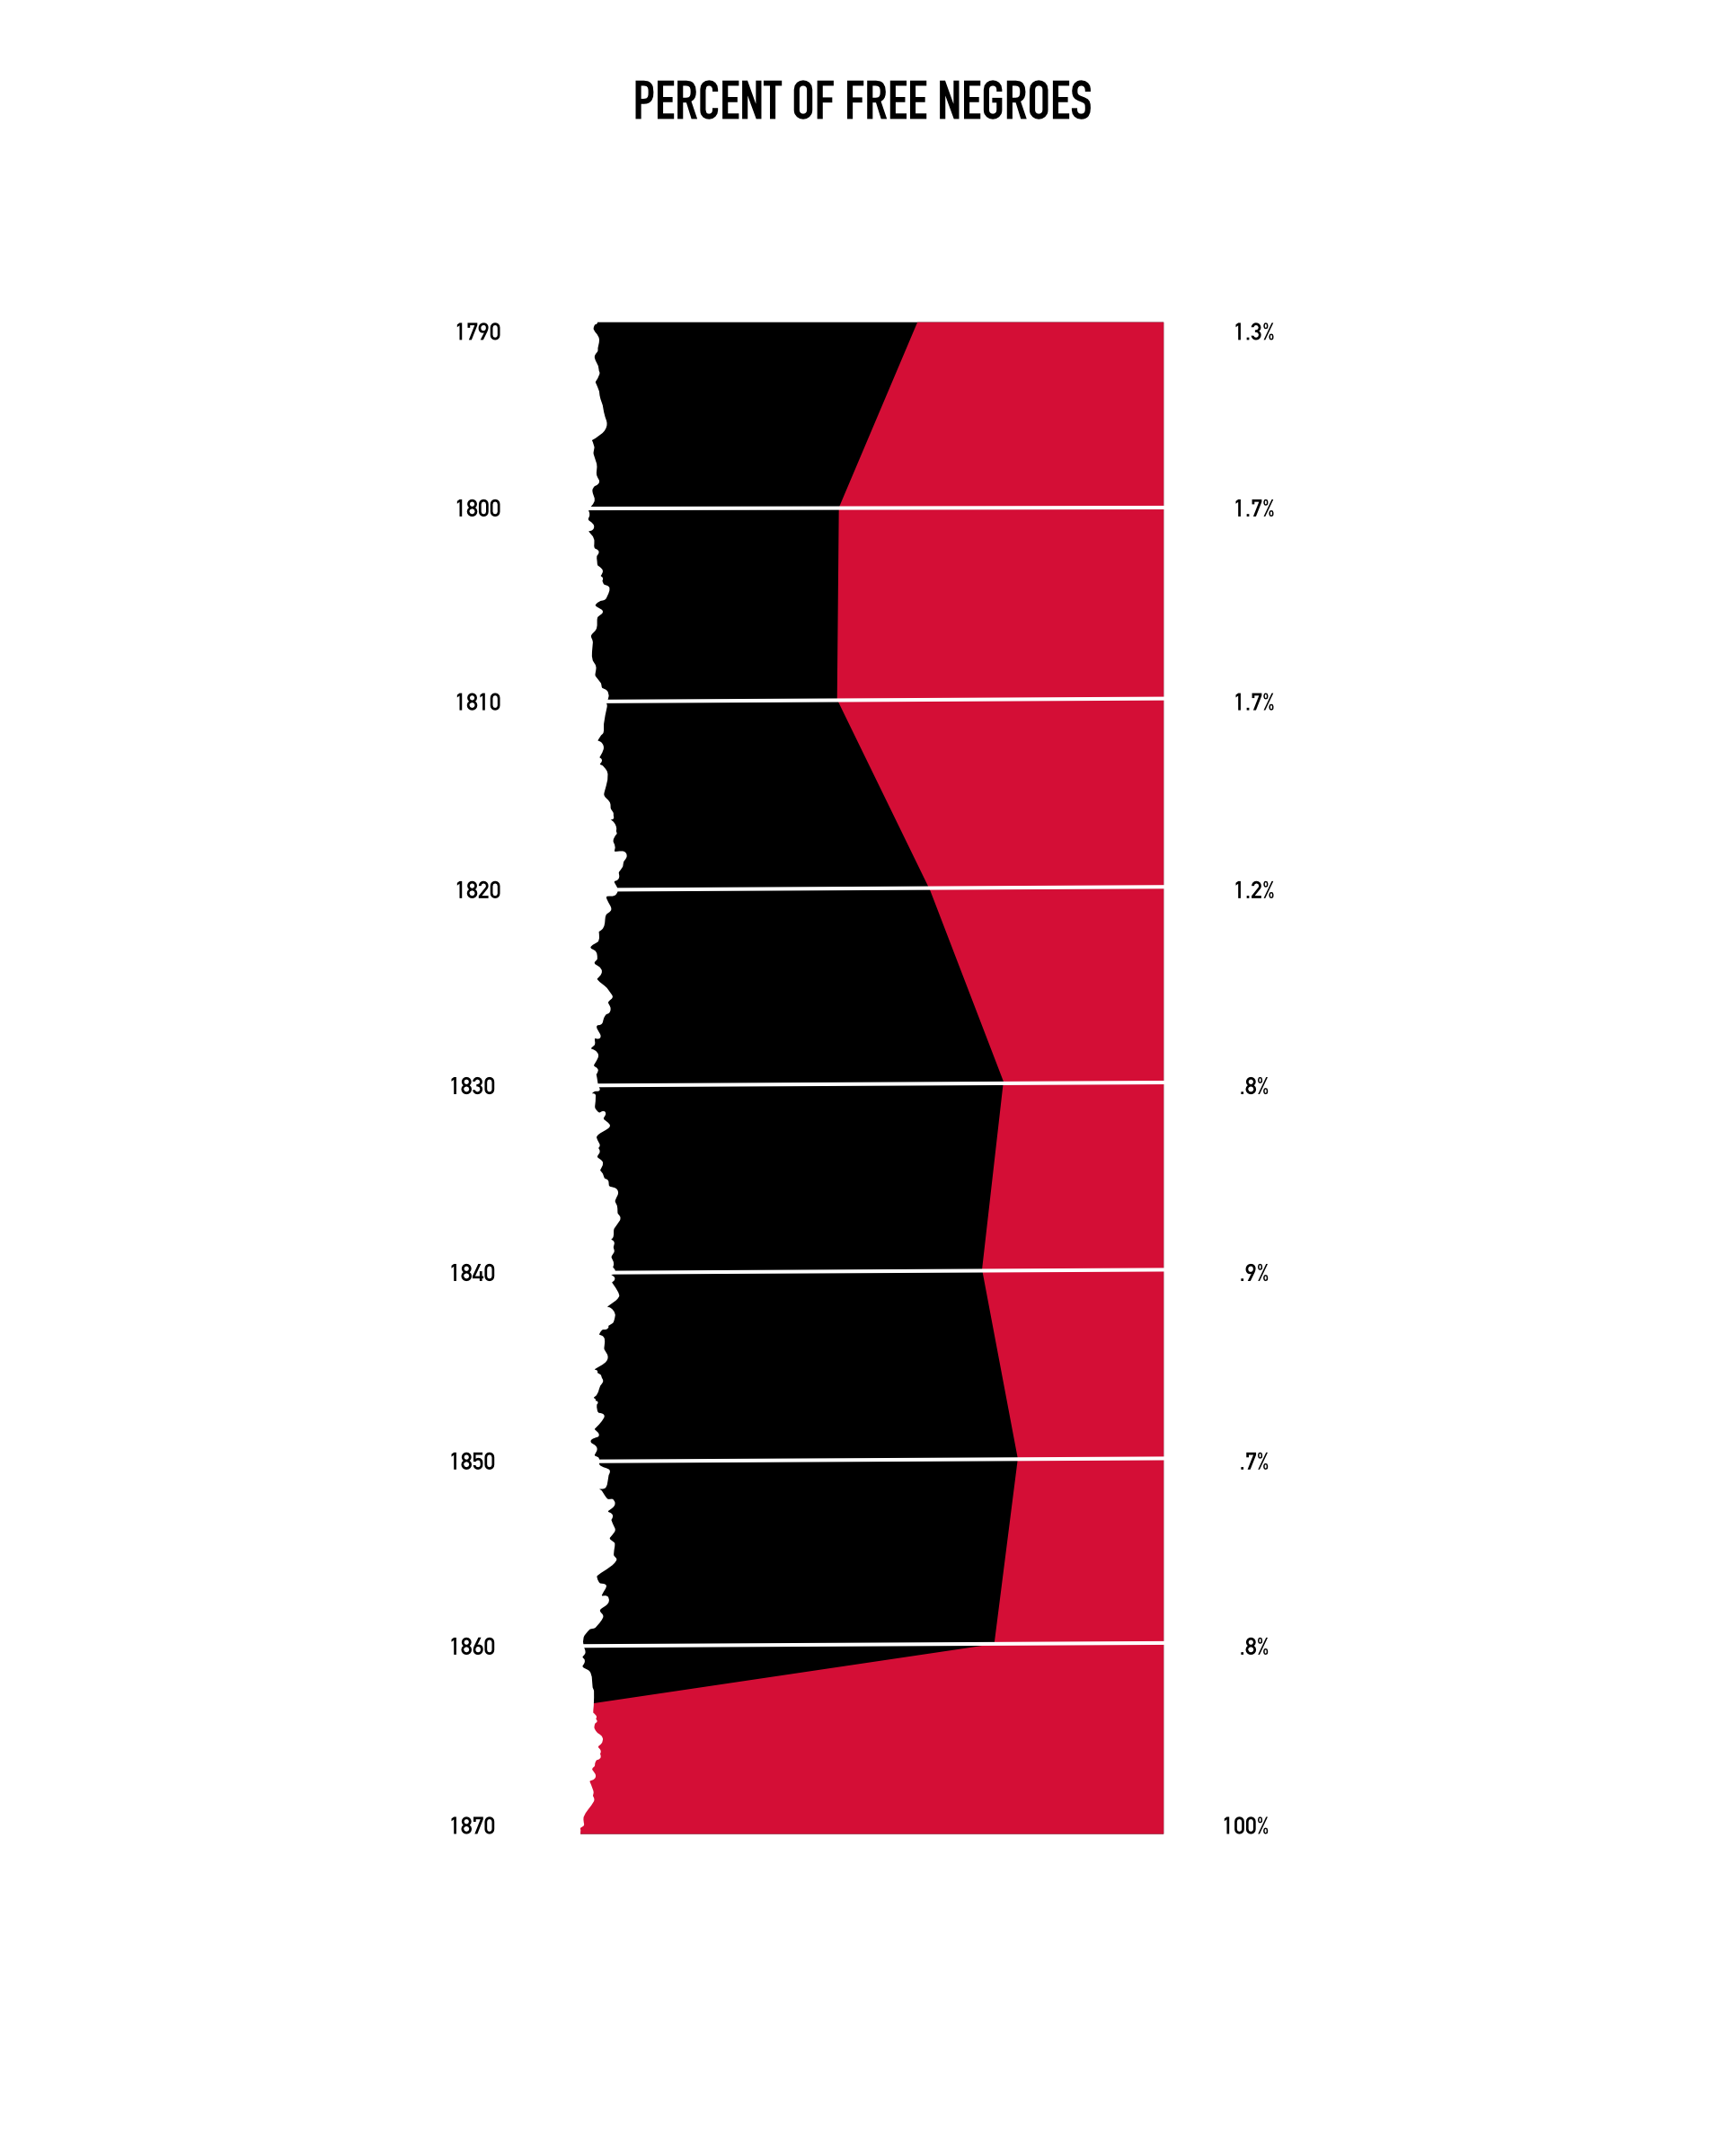
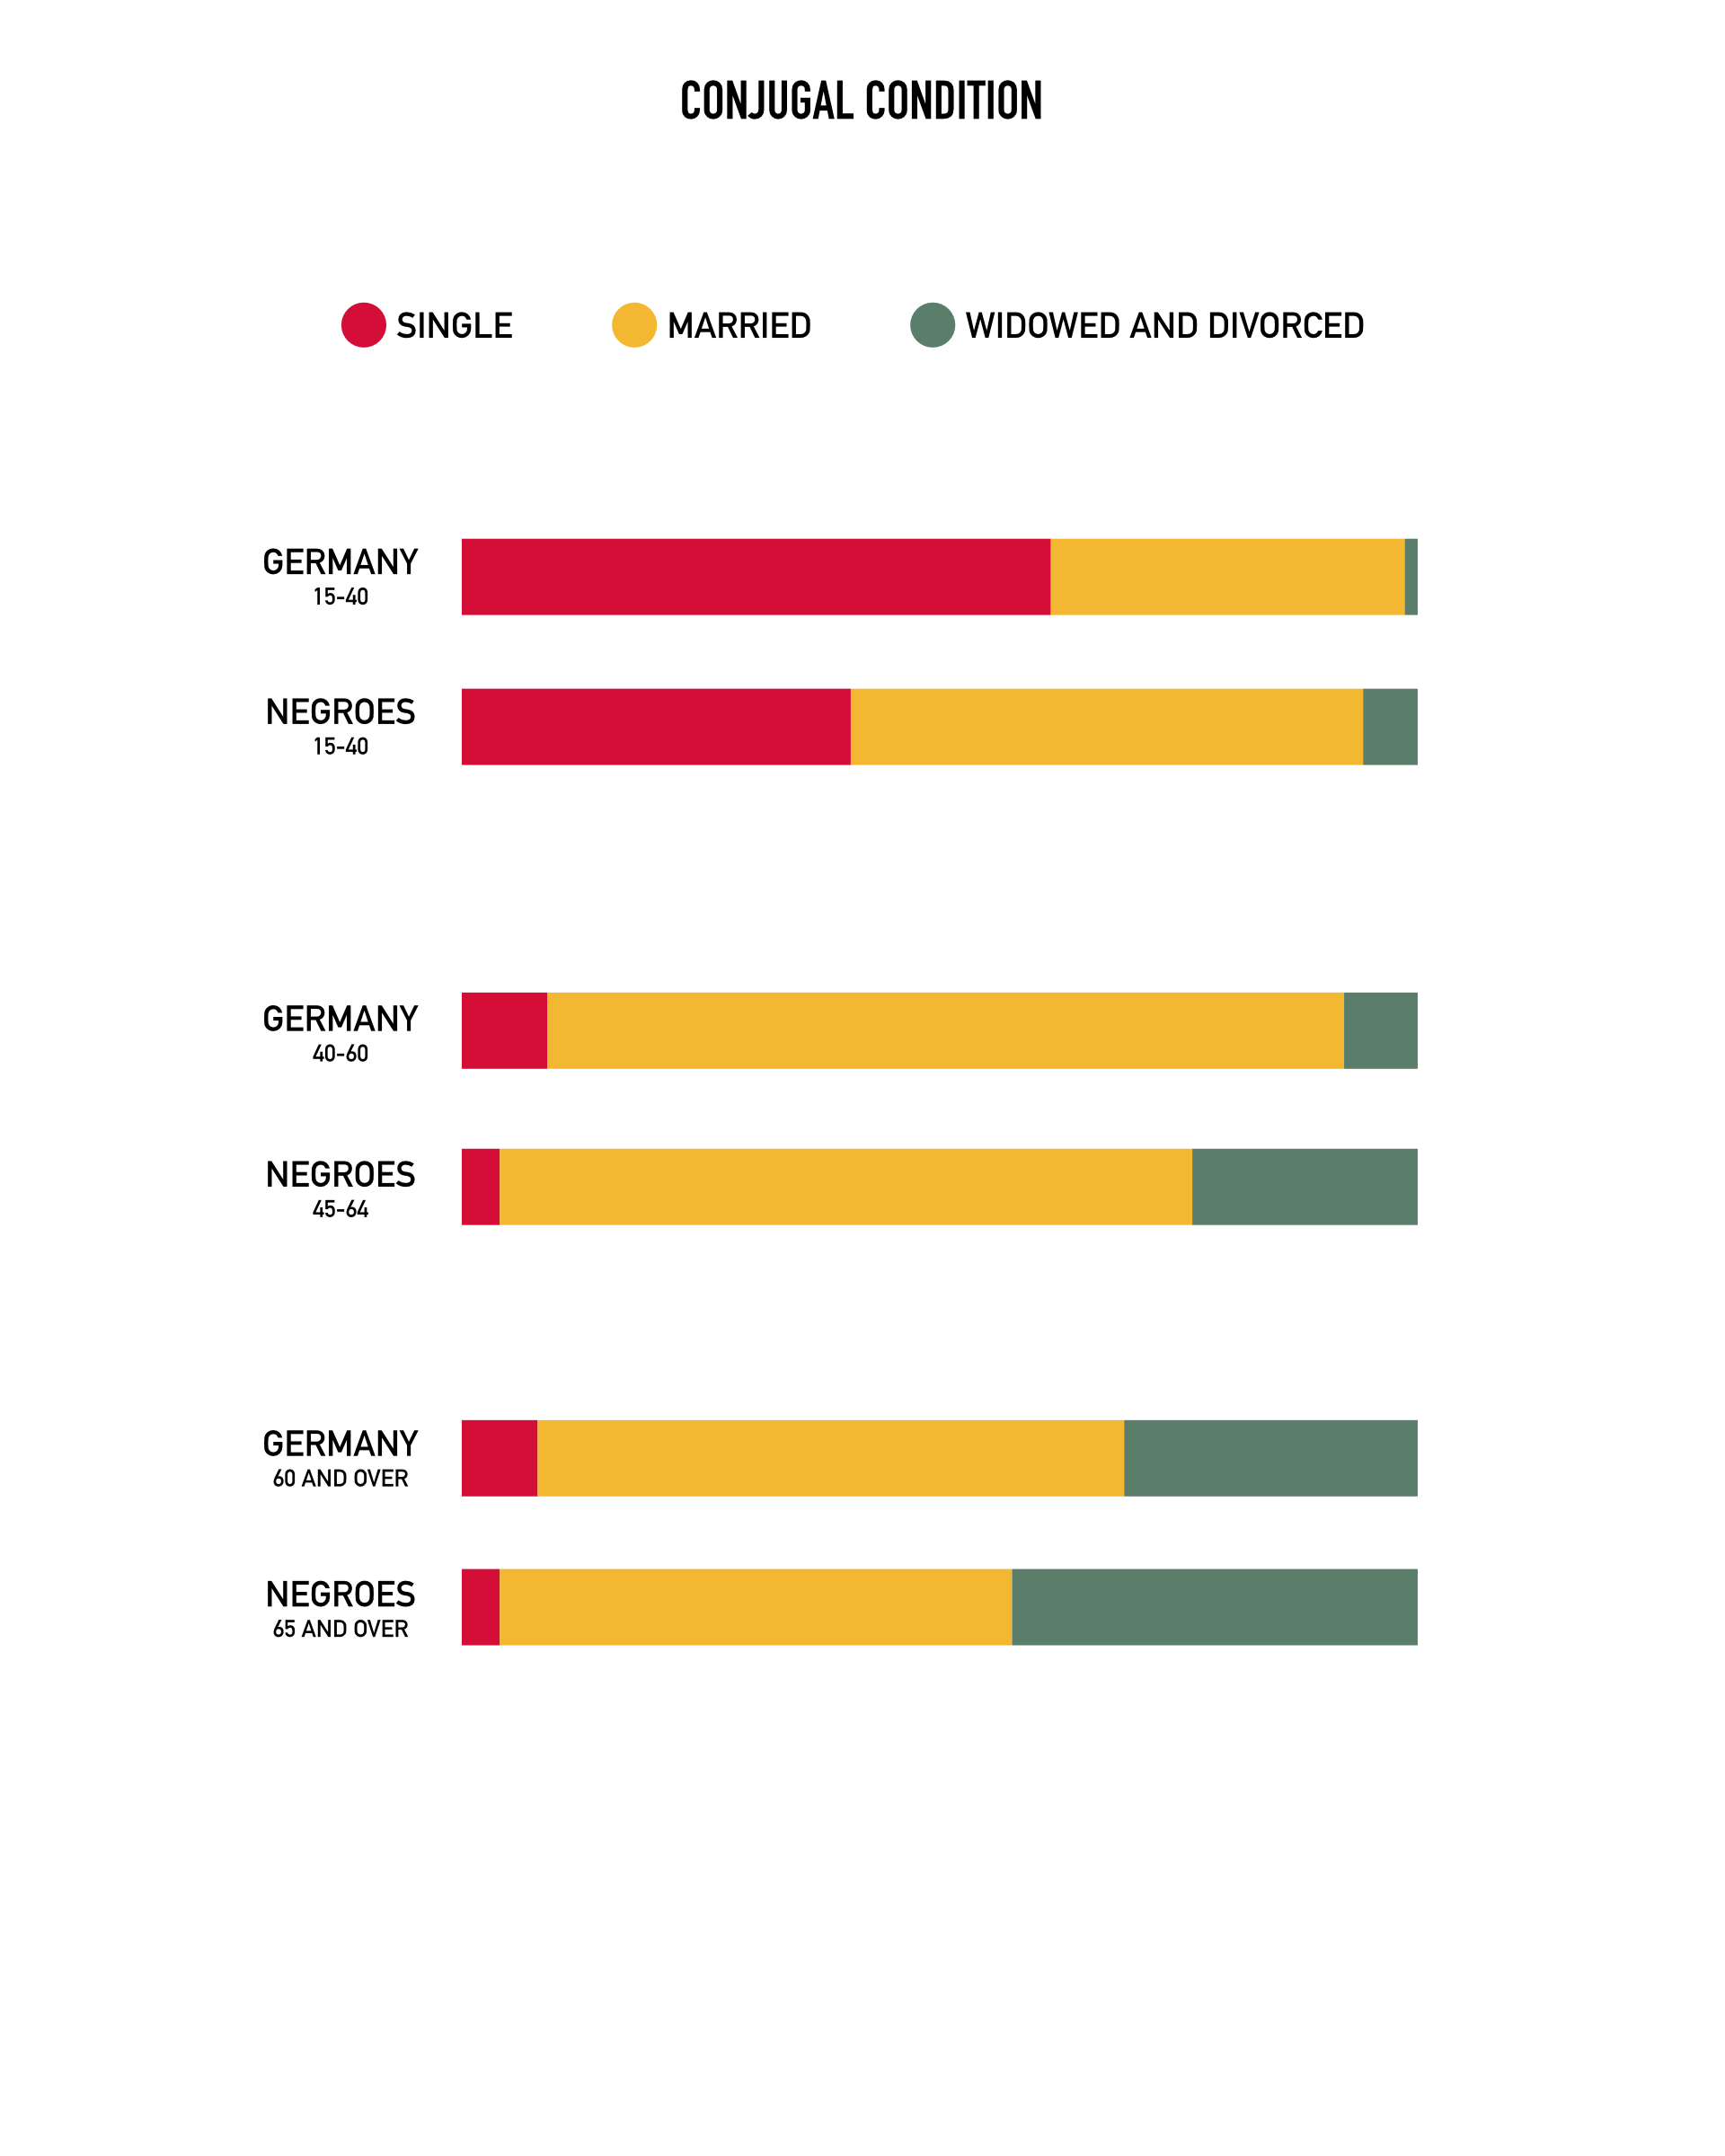
The original charts were prepared for the Negro Exhibit of the American Section at the Paris Exposition Universelle in 1900. The Library of Congress digitized them, but they showed signs of aging and weakness around the edges. I wanted to display them in my office in full and vibrant color, so I created the bar graph that shows percentage of African Americans in various occupations by sex, the circle graph that shows percentage of African Americans and whites in multiple occupations, the chart that shows percentage of enslaved African Americans compared to free African Americans from 1790 to 1870, the diagram showing the number of African American teachers teaching in Georgia public schools from 1888 to 1897, the graph showing percentage of illiterate African Americans from 1860 to 1900, and the graph of marital statuses by age of African Americans compared to Germans.
Select any image below to see a larger view.
our Stripes
Using the American flag as a visual metaphor for our experiences, I reimagined a new way of displaying the percentages of Blacks working in Professions each decade. The American flag is supposed to be a symbol of unity. In a hundred years, we still see echoes that our experiences are very different. The red portion highlights the period before the Voting Rights Act (1965).
Generational Shifts
I started this journey because of my curiosity to see how W.E.B. Du Bois's work would look today. I learned that against the backdrop of hundreds of years of free labor, when given the opportunity and time, our community shifted from laborer and domestic service occupations to professions in a single generation (1870-1900). In the 70s, ratios between communities were more level, but it took almost a century to shift that pattern.
Library of Congress, Prints & Photographs Division, LC-USZ62-38625
Assuming the 1980s marked a significant reduction in systemic discrimination against the Black community and considering a thriving community innovates every generation, 2010 saw the first Black U.S. President. The next monumental leap would be in 2040, barring further systemic shifts.
Highsmith, Carol M, photographer. Inaugural Parade. Michelle and Barack Obama join Joe Biden watch the parade from the viewing stand in front of the White House, Washington, D.C. United States Washington D.C. District of Columbia Washington D.C, 2009. Photograph. https://www.loc.gov/item/2010719312/.
Credits
Steven Ruggles, Sarah Flood, Ronald Goeken, Josiah Grover, Erin Meyer, Jose Pacas and Matthew Sobek. IPUMS USA: Version 10.0 [dataset]. Minneapolis, MN: IPUMS, 2020. https://doi.org/10.18128/D010.V10.0
The W.E.B. Du Bois Center at the University of Massachusetts Amherst. W.E.B. Du Bois's data portraits : visualizing Black America : the color line at the turn of the twentieth century; Hudson, NY : Princeton Architectural Press, 2018.
U.S. Bureau of Labor Statistics. Standard Occupational Classification (SOC). https://www.bls.gov/soc/
U.S. Census Bureau. North American Industry Classification System (NAICS). https://www.census.gov/eos/www/naics/
U.S. Bureau of Labor's Occupational Safety and Health Administration. Standard Industrial Classification (SIC). https://www.osha.gov/data/sic-manual
Library of Congress, Prints & Photographs Division, African American photographs for the Paris Exposition of 1900 (LOTs 11293-11308 and 11930-11932)
Highsmith, Carol M, photographer. One of the many Black Lives Matter events on or near Black Lives Matter Plaza in Washington, D.C. Washington D.C. Washington D.C. District of Columbia United States, 2020. -06-06. Photograph. https://www.loc.gov/item/2020720163/
Highsmith, Carol M, photographer. Inaugural Parade. Michelle and Barack Obama join Joe Biden watch the parade from the viewing stand in front of the White House, Washington, D.C. United States Washington D.C. District of Columbia Washington D.C, 2009. Photograph. https://www.loc.gov/item/2010719312/.
